11 Output and Dashboard
11.1 Output Files
Final results are stored in three geographic formats for each spatial level:
| Level | Formats | Variables |
|---|---|---|
| Parish (freguesia) | CSV + GeoPackage | All dimension scores + IMPT scores |
| Municipality (município) | CSV + GeoPackage | Population-weighted means + IMPT scores |
| H3 Grid | CSV + GeoPackage | Assigned from host parish + Computed at grid level when makes sense |
Results are uploaded to the U-Shift server at https://ushift.tecnico.ulisboa.pt/content/impt/, and to the GitHub releases.
Metadata is available in the Metadata appendix.
11.2 Dashboard Export
The dashboard export process consists of two main steps:
Data Loading:
06a_results_load.RThis script loads and prepares all indicator results (accessibility, mobility, safety, etc.) across the three spatial levels.Joining and Export:
06b_dashboard_export.RThis script joins the prepared indicator tables and all the relevant metrics with the spatial geometry files and exports them as three aggregated GeoJSON files for direct use in the web dashboard:
grid_{aggregated/dashboard¹}.geojsonfreguesias_{aggregated/dashboard¹}.geojsonmunicipios_{aggregated/dashboard¹}.geojson
¹
aggregatedrefers to the full dataset,dashboardto a reduced version with only the variables displayed for faster loading.
A champions lookup file (champions.json) is also exported, identifying the top contributing indicators to each dimension’s PC1 score, for display in the dashboard sidebar.
Mind that the columns of data loaded at code/06a_results_load.R and those exported by code/06b_dashboard_export.R may differ, as the latest script performs some data cleaning and renaming to ensure data standardization and consistency.
For instance, different naming for the same mode are replaced by a single naming (such as “road”, “carro” or “private_vehicle” to “car”) and the mode in any variable is moved to the end of the variable name to simplify the frontend data binding (for example, access_recreation_walk_15min_residents becomes access_recreation_15min_residents_walk).
11.3 Web Dashboard
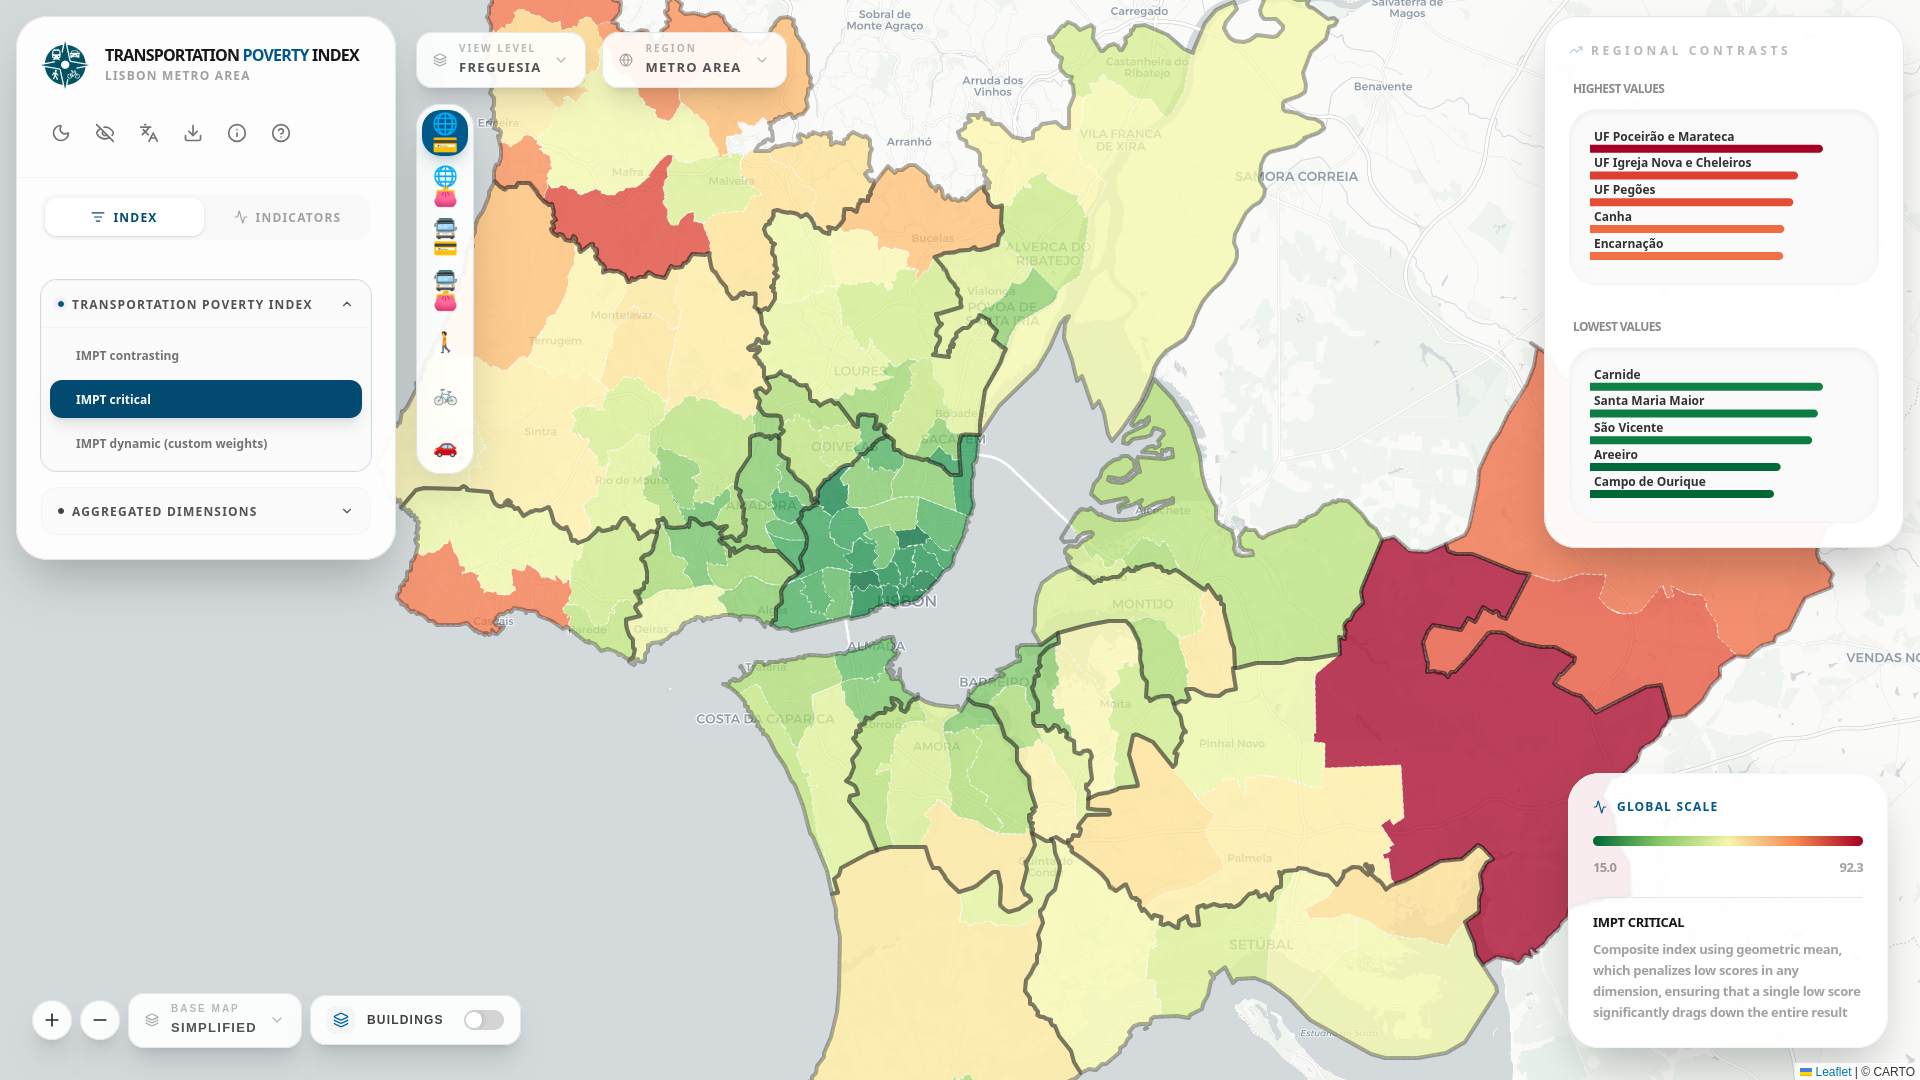
The IMPT results are visualised in an interactive web dashboard (Figure 11.1) built with React (Meta 2026) + Vite (V. Inc. 2026), using Leaflet (Agafonkin 2026) for map rendering and Tailwind CSS (T. L. Inc. 2026) for styling. The dashboard is available at:
The dashboard provides a comprehensive suite of features for exploring the data:
- Multi-scale Map Visualisation: Explore indicators by geographic level (Grid, Parish, Municipality), transport mode (Car, PT, Bike, Walk), and specific land-use and socio-demographic variables.
- Composite Index Aggregation: Switch between different IMPT calculation methods, including equal weights, critical (geometric mean), contrasting (entropy), or dynamic user-defined weights.
- AHP Weighting Methodology: Built-in Analytic Hierarchy Process (AHP) survey to help users mathematically derive optimal, consistent dimension weights for the dynamic IMPT score.
- PT Fare Scenarios: Toggle between single-fare and Navegante pass scenarios to immediately see their impact on affordability.
- Area Profiling: Detailed side-panels showing regional contrasts, subarea dynamics, and modal share profiles for the selected geographic unit.
- Contextual and Land Use Layers: View built area classifications, population density, and demographic ratios alongside mobility metrics.
- Accessibility & UI: Colorblind mode, light/dark theme toggles, and switchable base maps (Simplified, Satellite, OpenStreetMap).
- Open Data: Direct download of all the results and indicators as CSV and GeoJSON.