8 Affordability
Script: 04_affordability.R, 04_mobility_costs_money_car.R, 04_mobility_costs_money_pt.R, 04_mobility_costs_money_pt_cost_structure.R
Package: r5r (Pereira et al. 2021)
Affordability is assessed by comparing annual transport and housing costs against household income. Commuting costs are computed for both car and public transport using r5r::detailed_itineraries() on the full set of IMOB OD commuting pairs. The costs are estimated for one-way trips (home - workplace) during the morning peak.
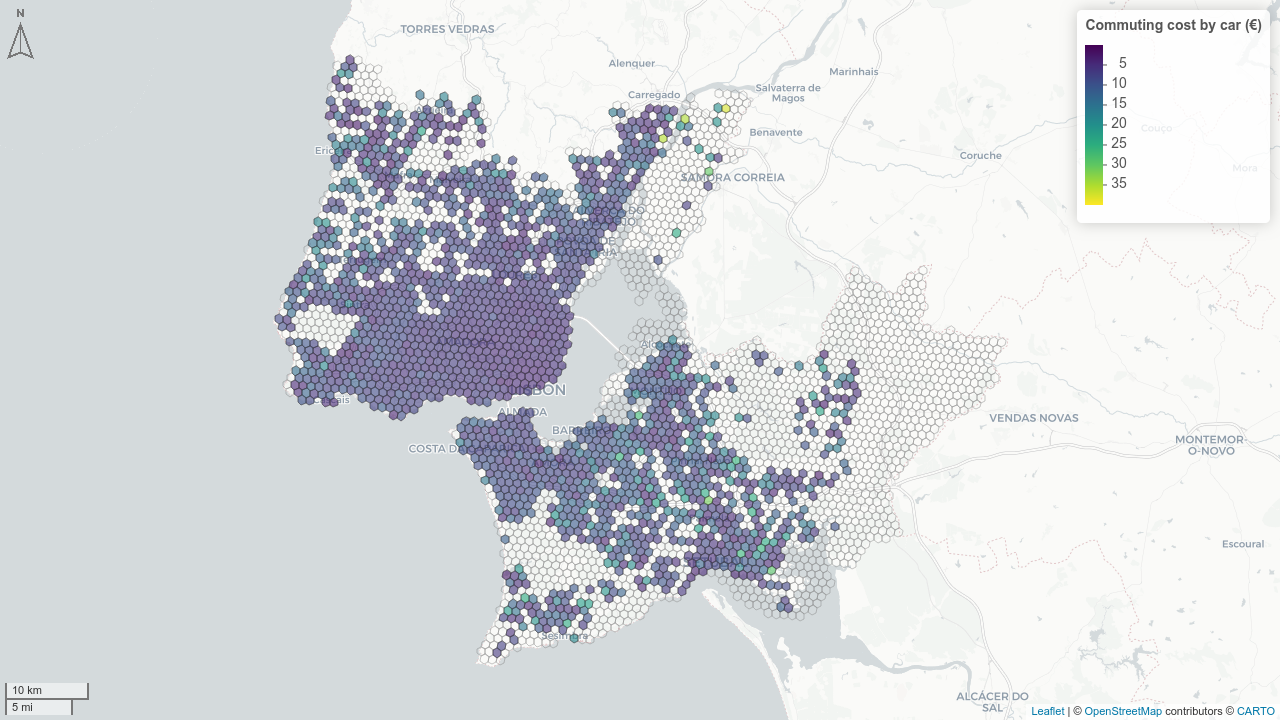
8.1 Car costs
Script: 04_mobility_costs_money_car.R
Car commuting cost per trip = distance cost + tolls:
\[C_{car} = d \times 0.40\text{ €/km} + C_{toll}\]
The fixed cost of 0.40 €/km is based on Portaria n.º 1553-D/2008 de 31 de dezembro (Ministério das Finanças e da Administração Pública 2008), which sets mileage allowance covering fuel and car maintenance.
Tolls are computed via the Infraestruturas de Portugal toll calculator (IP 2026) using the route geometry returned by r5r::detailed_itineraries().
8.2 Public transport costs — Two scenarios
Scripts: 04_mobility_costs_money_pt.R, 04_mobility_costs_money_pt_cost_structure.R
To account for uncertainty in PT fare payment practices, two cost scenarios are defined:
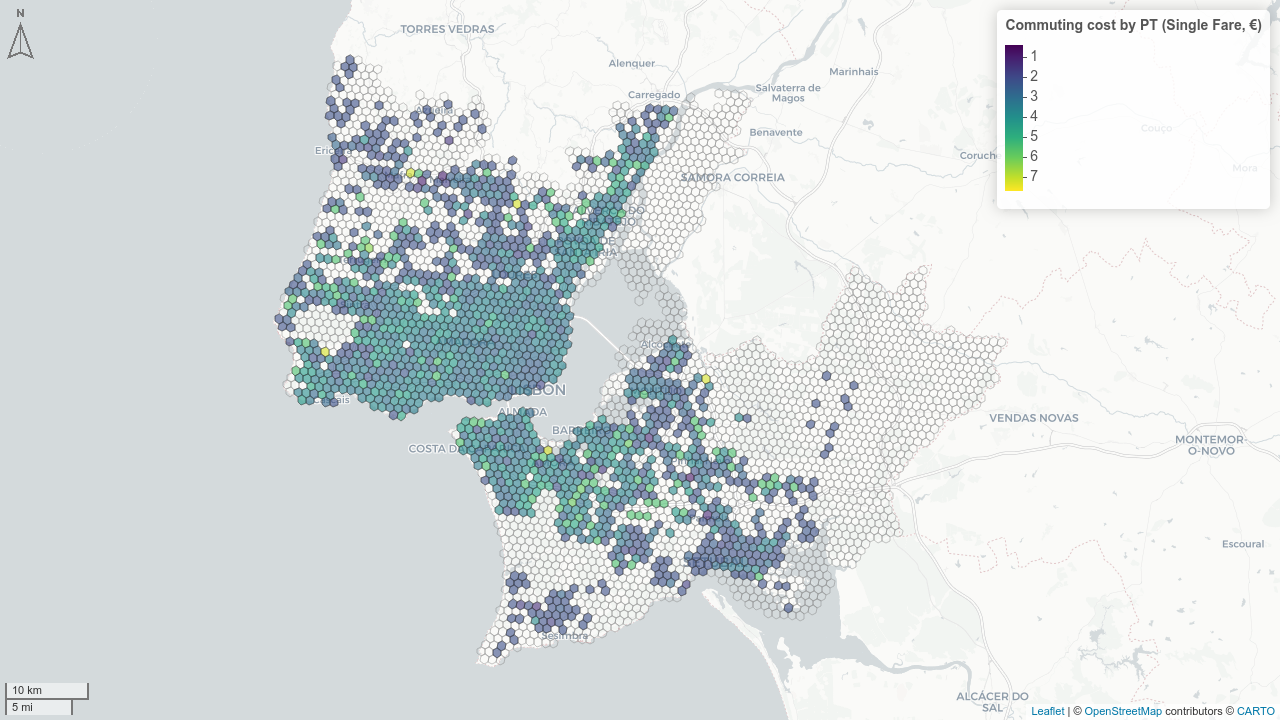
Scenario A — Single fare (pre-Navegante baseline):
Based on Carris Lisboa revenue data (Carris 2024):
- Total single ticket validations: 17,424,000
- Total single ticket revenue: 33,278,000 €
- Average cost per single ticket: ~1.91 €
For Metropolitano de Lisboa, the cost per single ticket (Metro de Lisboa 2025) is 1.72 to 1.90 € depending on the line and whether it crosses the river.
We assumed a single ticket cost of 1.91 € for all modes in Scenario A. Free transfers within the same mode for 60 minutes are assumed. Different-mode transfers incur an additional charge.
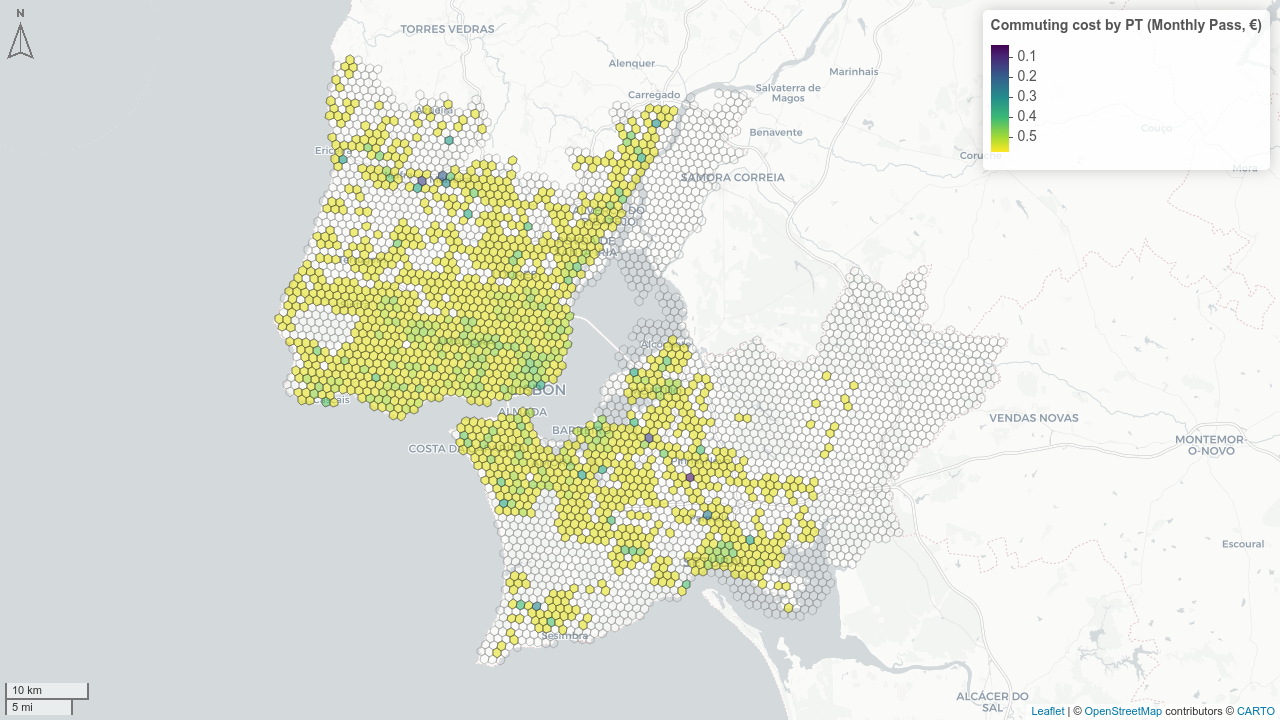
Scenario B — Monthly pass (Navegante):
Based on operator revenue data for monthly passes:
| Pass type | Pass recharges | Price |
|---|---|---|
| Navegante Metropolitano | 5,063,510 | 40 € |
| Navegante Municipal | 887,190 | 30 € |
| Senior (65+) | 1,103,782 | 20 € |
| Family | 243,784 | 80 € |
| Youth (Sub-23) | 3,425,013 | 0 € |
Average monthly cost paid per pass holder: ~25.25 €
Assuming 44 journeys/month (2 trips × 22 working days): ~0.57 €/trip
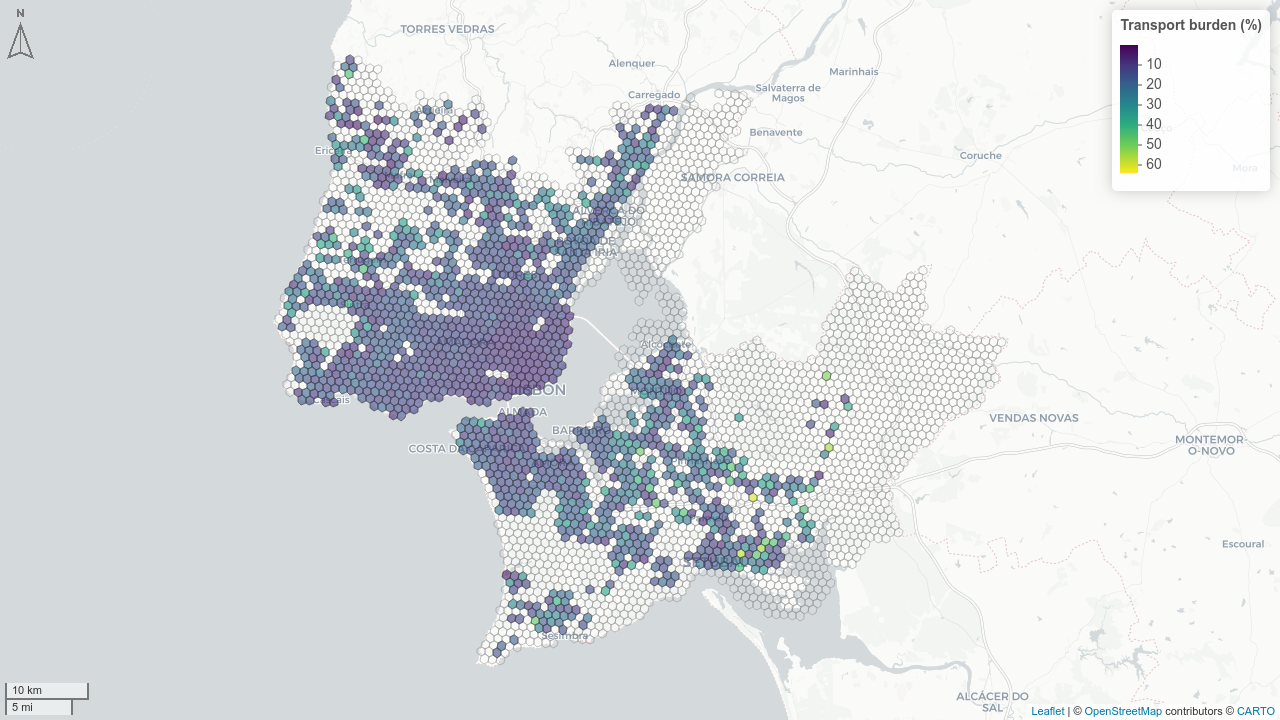
8.3 Composite affordability indicators
Transport expenditure is expressed as a share of household income, with two variants (with and without housing costs): We considered 250 working days per year to calculate the annual transport costs (two trips per day). Toll costs are considered for both ways differently, since the bridges’ tolls are paid only one-way.
\[\text{transp\_inc}_{car} = \frac{C_{car}}{I_{household}}\]
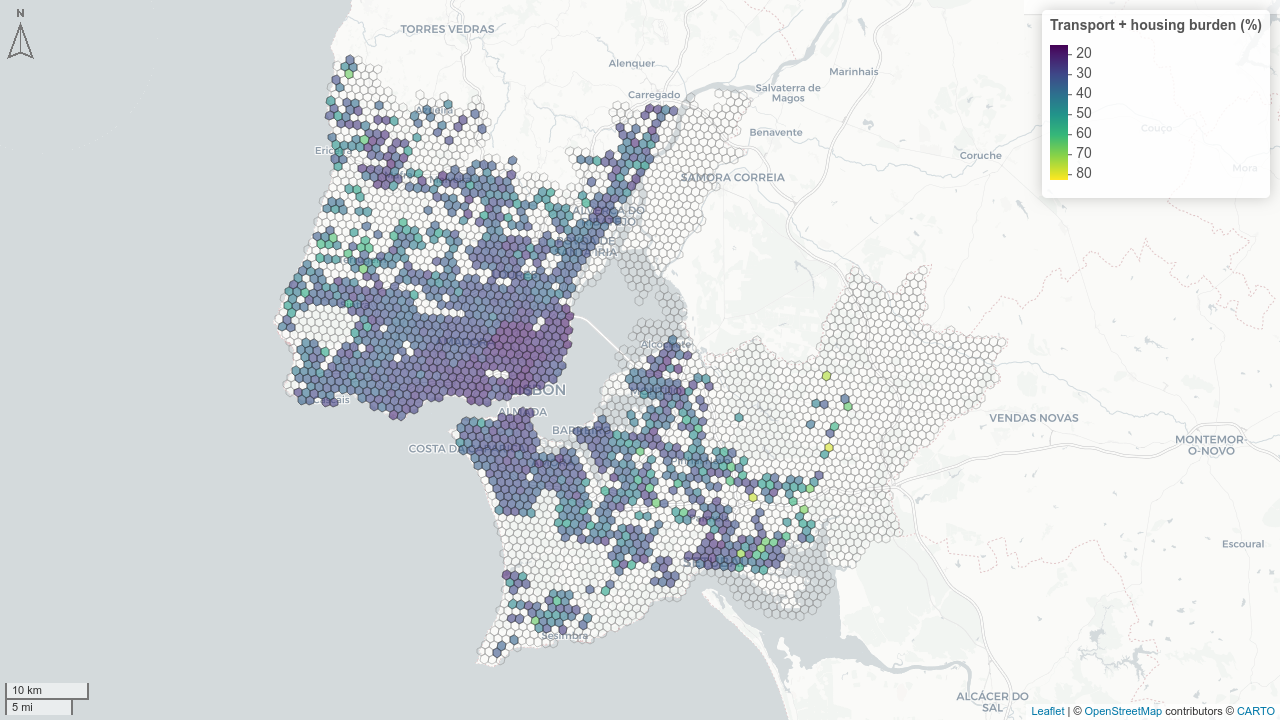
\[\text{h\_transp\_inc}_{car} = \frac{C_{car} + C_{housing}}{I_{household}}\]
All costs are annualised and computed for a single household[€/year/household].
A modal-share-weighted composite indicator combines car and PT costs proportionally to Census 2021 modal shares:
\[\text{transp\_inc}_{weighted} = \frac{C_{car} \cdot s_{car} + C_{PT} \cdot s_{PT}}{s_{car} + s_{PT} + s_{active}}\]
where \(s_m\) is the modal share of mode \(m\) from Census 2021.
Car costs are additionally adjusted for vehicle occupancy rate (from IMOB 2017, Table IV.7) and household size and mobile population fraction (from IMOB 2017, Table II.1), to convert per-trip costs to a household-level annual burden.
To convert per-trip costs to a household-level annual burden, the final annual household transport expenditure as a share of income, accounting for all adjustments and modal shares, is computed as:
\[ \text{transp\_inc\_comp} = \frac{HH_{\text{size}} \cdot P_{\text{mobile}}}{I_{\text{household}}} \cdot \left[ \left( \frac{C_{\text{car,day}}}{O} \cdot \frac{s_{\text{car}}}{s_{\text{car}} + s_{\text{PT}} + s_{\text{active}}} \right) + (C_{\text{PT,day}} \cdot \frac{s_{\text{PT}}}{s_{\text{car}} + s_{\text{PT}} + s_{\text{active}}}) \right] \cdot N_{\text{days}} \]
Where:
- \(N_{\text{days}} = 250\) working days per year.
- \(HH_{\text{size}}\) is the average household size.
- \(P_{\text{mobile}}\) is the fraction of mobile population.
- \(I_{\text{household}}\) is the average annual household income.
- \(C_{\text{car,day}}\) and \(C_{\text{PT,day}}\) are the round-trip costs for car and public transport.
- \(O\) is the vehicle occupancy rate.
- \(s_{\text{car}}\), \(s_{\text{PT}}\), and \(s_{\text{active}}\) are the modal shares from Census 2021.
For the variant including housing costs (\(\text{h\_transp\_inc\_comp}\)), the annualised housing cost \(C_{\text{housing,year}}\) is added to the numerator.
Income data: household income per parish from INE (Rendimento agregado 2023). (INE 2025) (See Section 8.4))
Housing costs: median monthly housing cost per parish from INE (Habitação custos 2021). (INE 2022) (See Section 8.5))
The parish of Canha (dtmnfr = 150701) is not served by any GTFS operator, resulting in NA PT costs. These values are imputed using the mean of neighbouring parishes within the same municipality (Montijo).
8.4 Income, Gini Coefficient and Palma Ratio
Script: 02_land_use_export.R
Source: INE — Rendimento Agregado Local 2023 (ERendimentoNLocal2023.xlsx). (INE 2025)
Income — total median annual income, by household, liquid, is sourced from Statistics Portugal (INE), at municipality and parish levels.
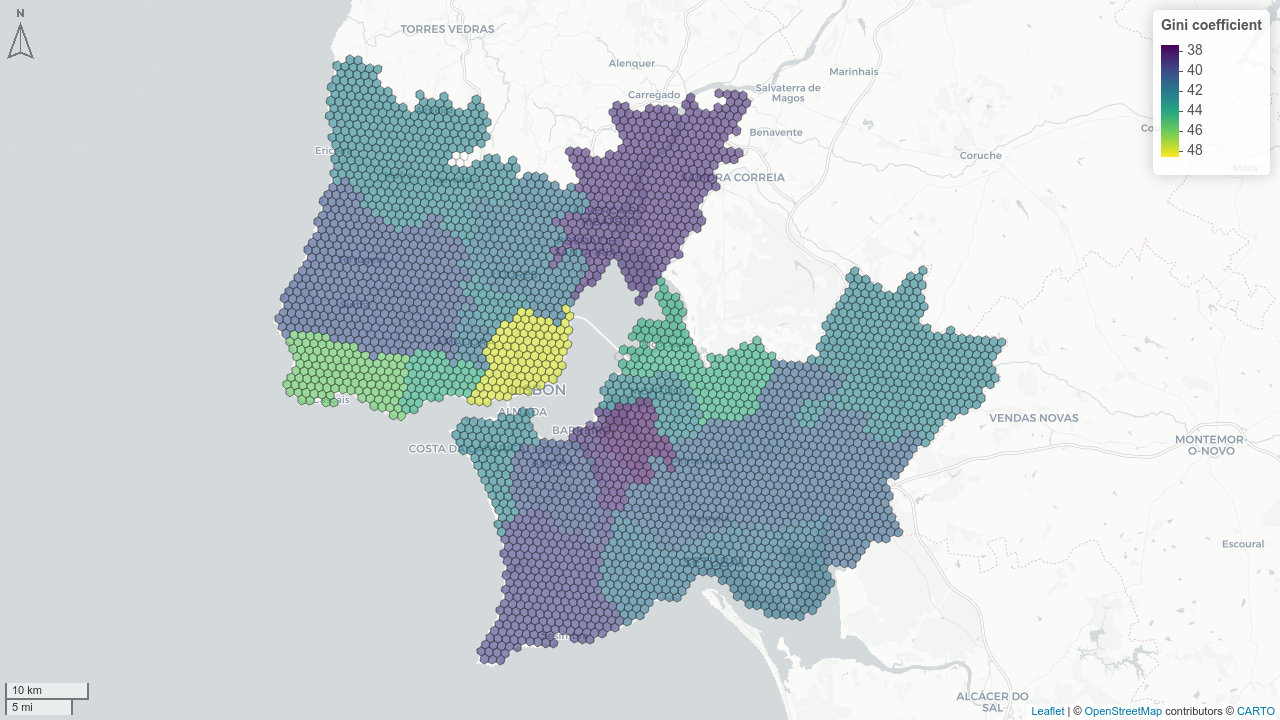
Income inequality is characterised by two indicators computed at municipality level and assigned to parishes and grid cells:
Gini coefficient (Figure 8.4) — measures overall income inequality on a scale from 0 (perfect equality) to 1 (maximum inequality). Data is computed directly from the INE publication for each municipality. Income is considered by mean household income, liquid.
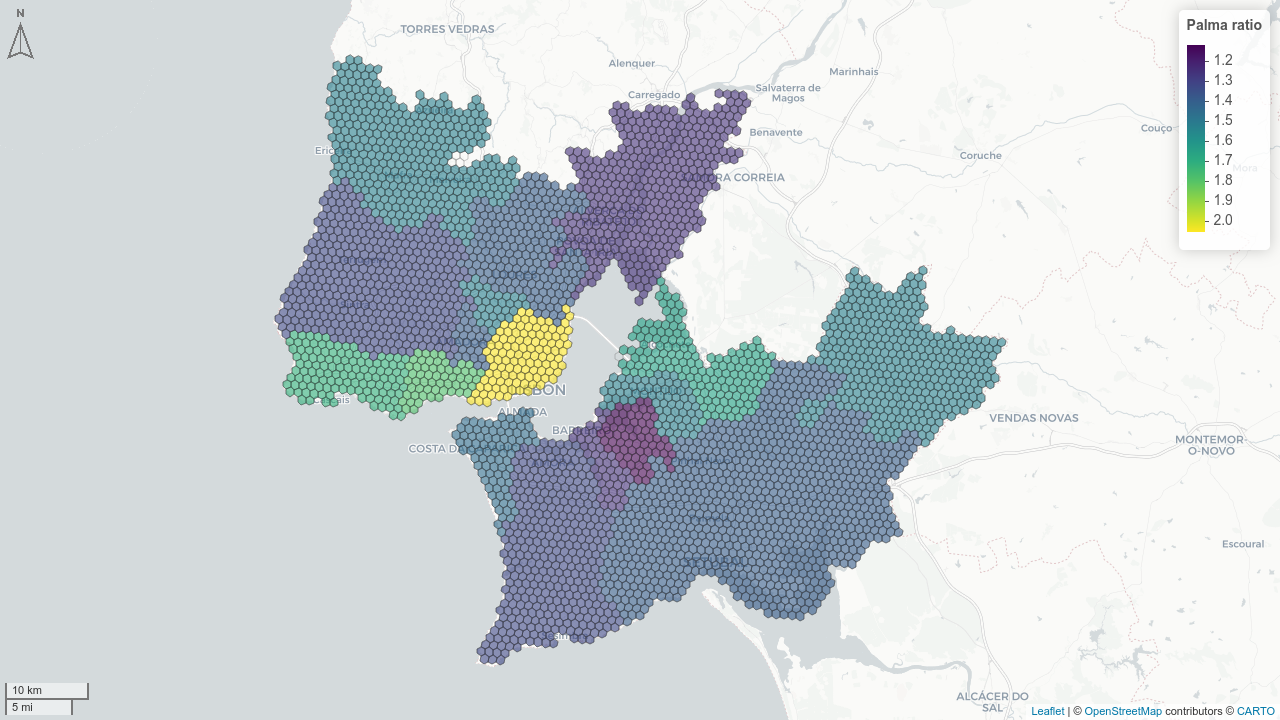
Palma ratio (Figure 8.5) — measures the ratio of the income share of the top 10% to the bottom 40% of the population, a measure more sensitive to inequality at the extremes:
\[\text{Palma} = \frac{\text{income share of top 10\%}}{\text{income share of bottom 40\%}}\]
Both indicators are sourced directly from the INE publication for each municipality and parish. Grid cells are assigned the values of their corresponding parish via the grid_nuts.csv cross-reference table.
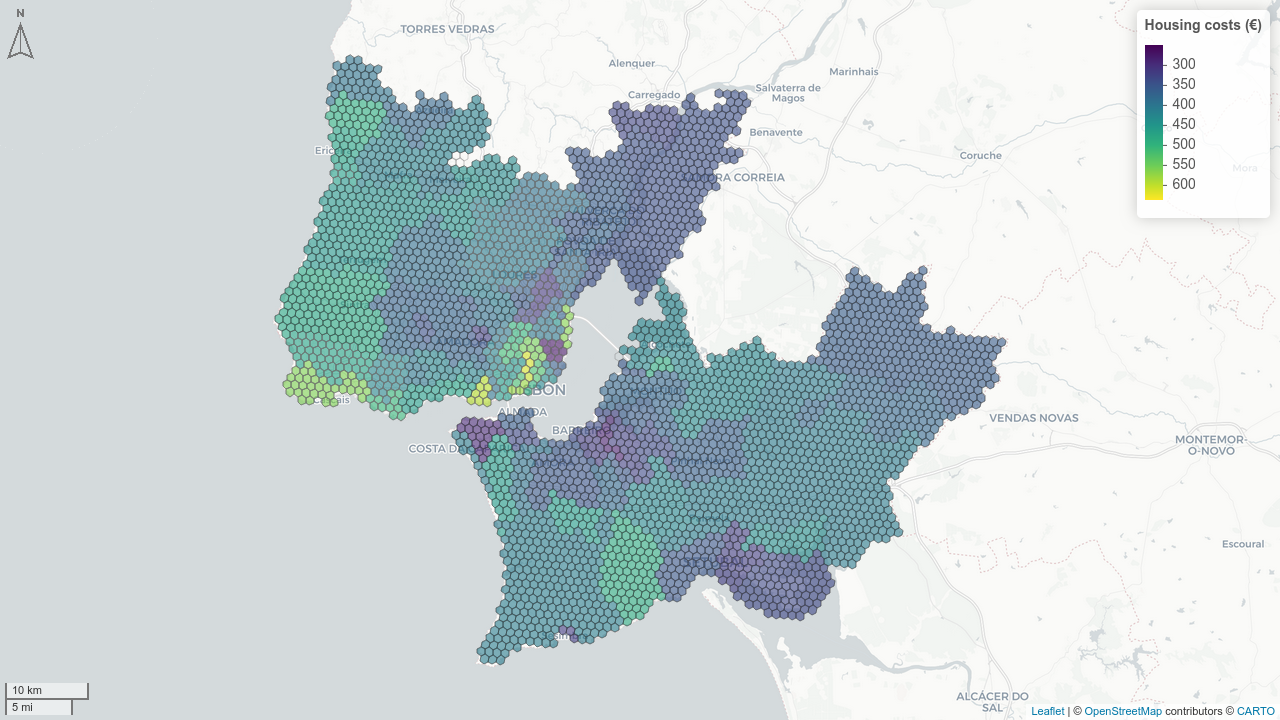
8.5 Housing costs
Script: 02_land_use_export.R
Source: INE — Habitação custos 2021 (Habitaccao_Custos_2021.xlsx). (INE 2022)
Median monthly housing cost and rent, by parish, is sourced from Statistics Portugal (INE), Census 2021, at municipality and parish levels (Figure 8.6). Grid cells are assigned the values of their corresponding parish via the grid_nuts.csv cross-reference table.