IMPT - Methodological Report
IMPT — Índice Multidimensional e Multimodal de Pobreza nos Transportes
1 Introduction
This document describes the methodology behind the Índice Multimodal de Pobreza nos Transportes (IMPT) — a composite, multimodal transport poverty index developed for the Lisbon Metropolitan Area (Área Metropolitana de Lisboa, AML) by the U-Shift Lab at Instituto Superior Técnico.
This research is funded by PLANAPP - Centro de Planeamento e de Avaliação de Políticas Públicas, in collaboration with the Fundação para a Ciência e Tecnologia, under the Science4Policy (S4P): Concurso de Estudos de Ciência para as Políticas Públicas call (PLANAPP-S4P/8042/2025).
The IMPT is designed to quantify the degree to which residents in different locations across the AML are disadvantaged in terms of access, mobility, affordability, and safety across multiple transport modes (car, public transit, cycling, walking). It is intended to be reproducible and replicable for other metropolitan areas in Portugal.
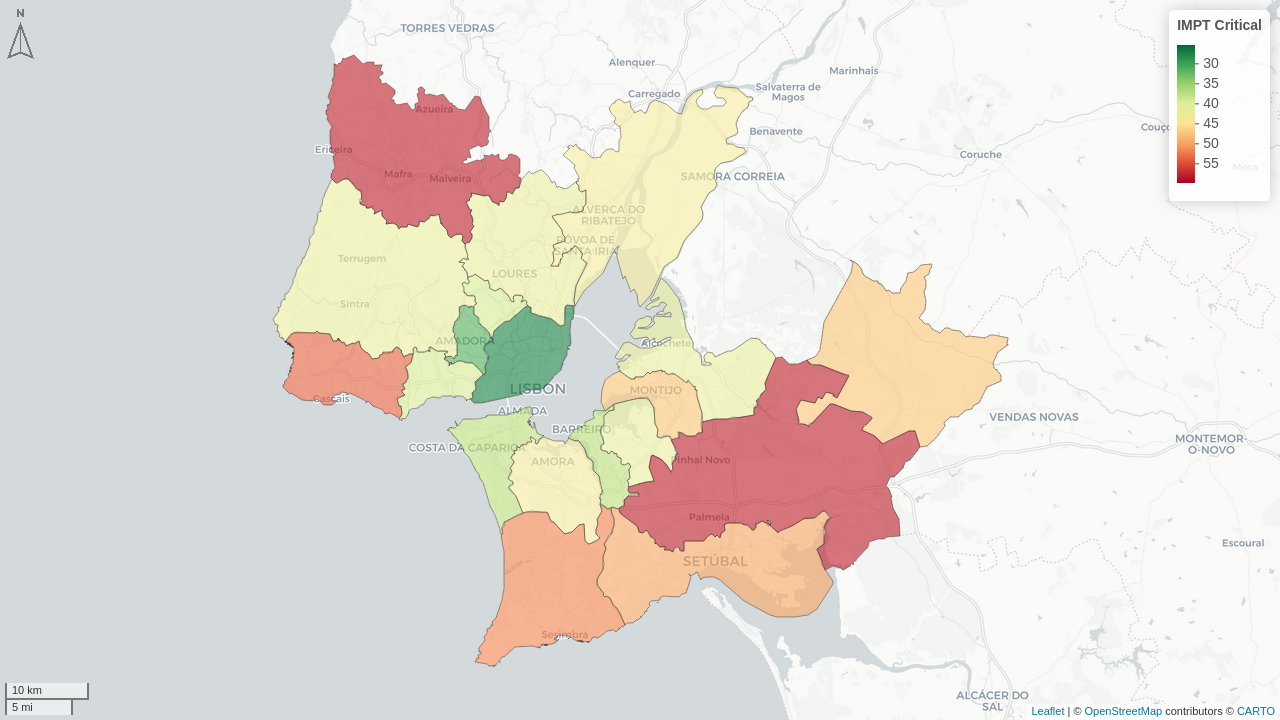
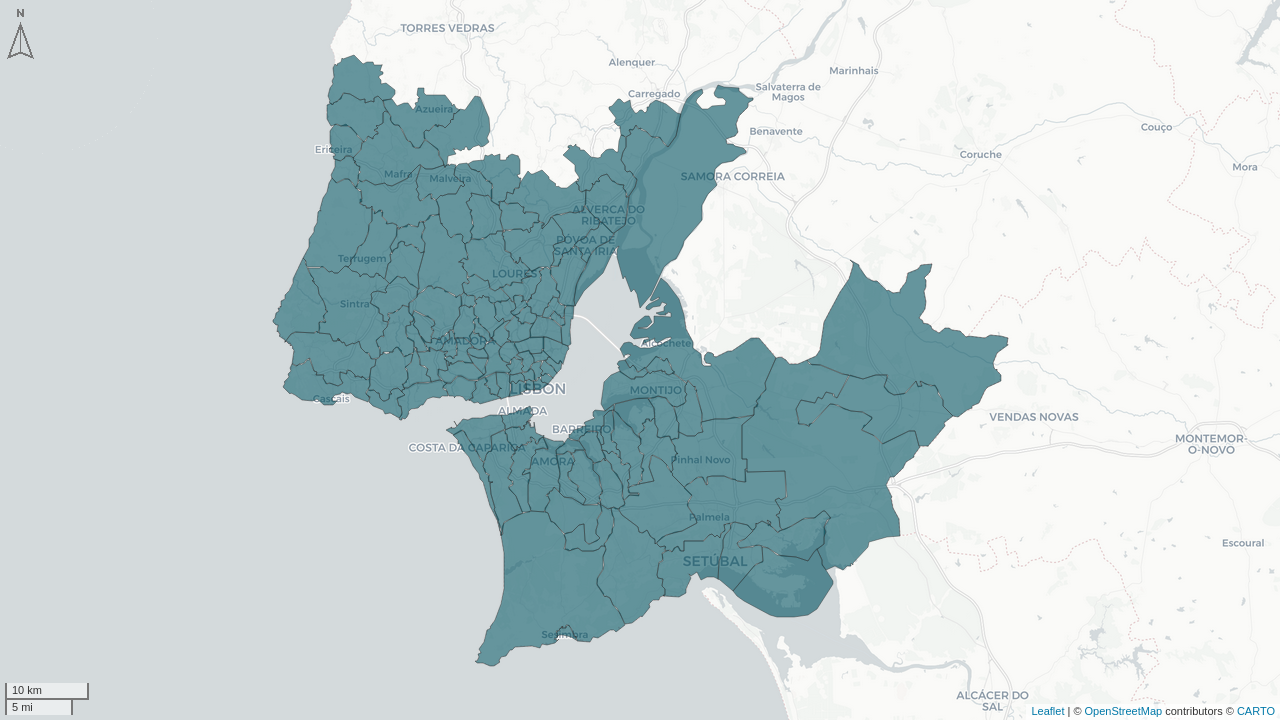
The index (Figure 1.1) covers 124 parishes (freguesias, or districts) and 18 municipalities (municípios) in the Grande Lisboa and Península de Setúbal NUTS-II sub-regions, corresponding to approximately 2.87 million inhabitants (INE 2021).
1.1 Study Area
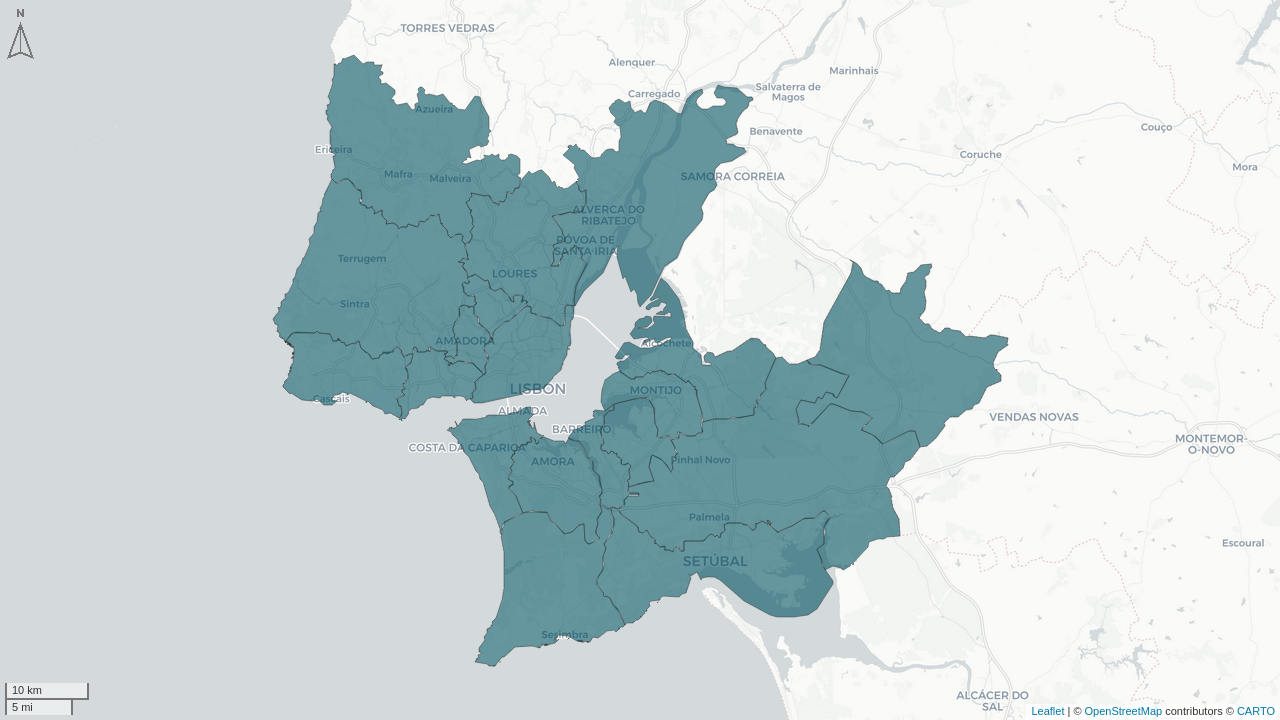
The study area corresponds to the Lisbon Metropolitan Area (AML), defined as the combination of the NUTS-III sub-regions Grande Lisboa and Península de Setúbal, using administrative boundaries from CAOP 2024.1 (DGT 2024).
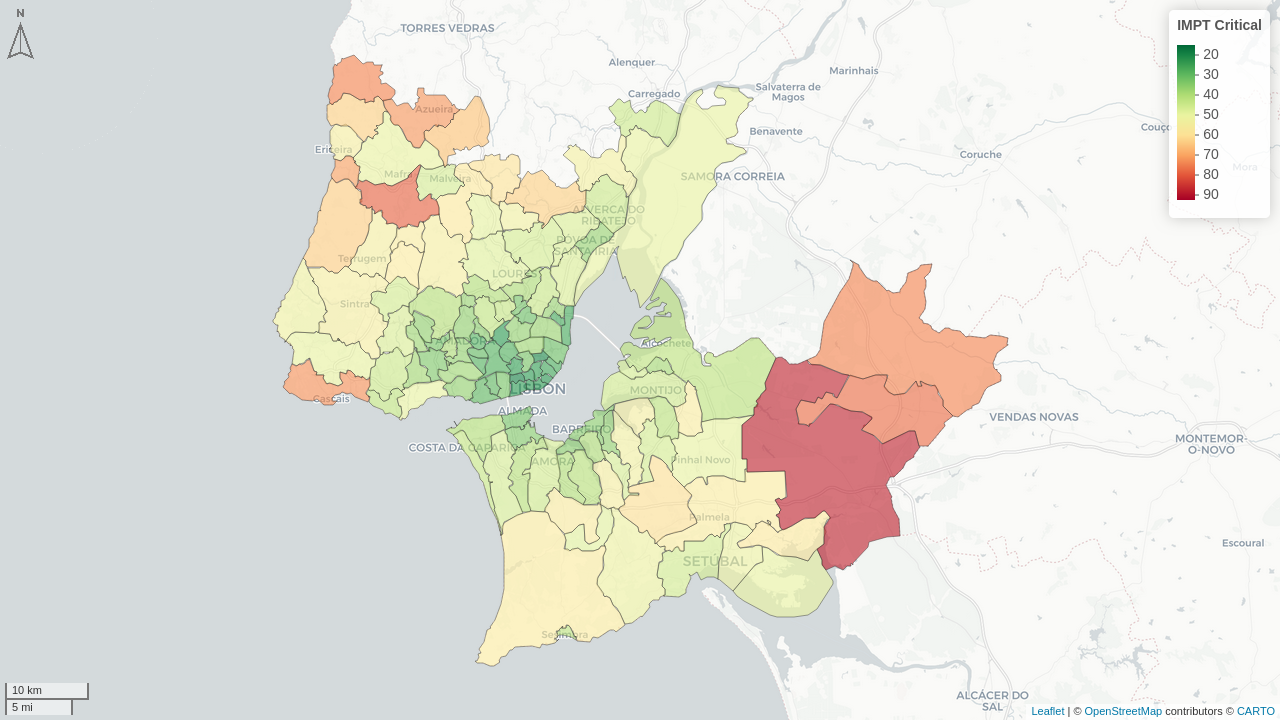
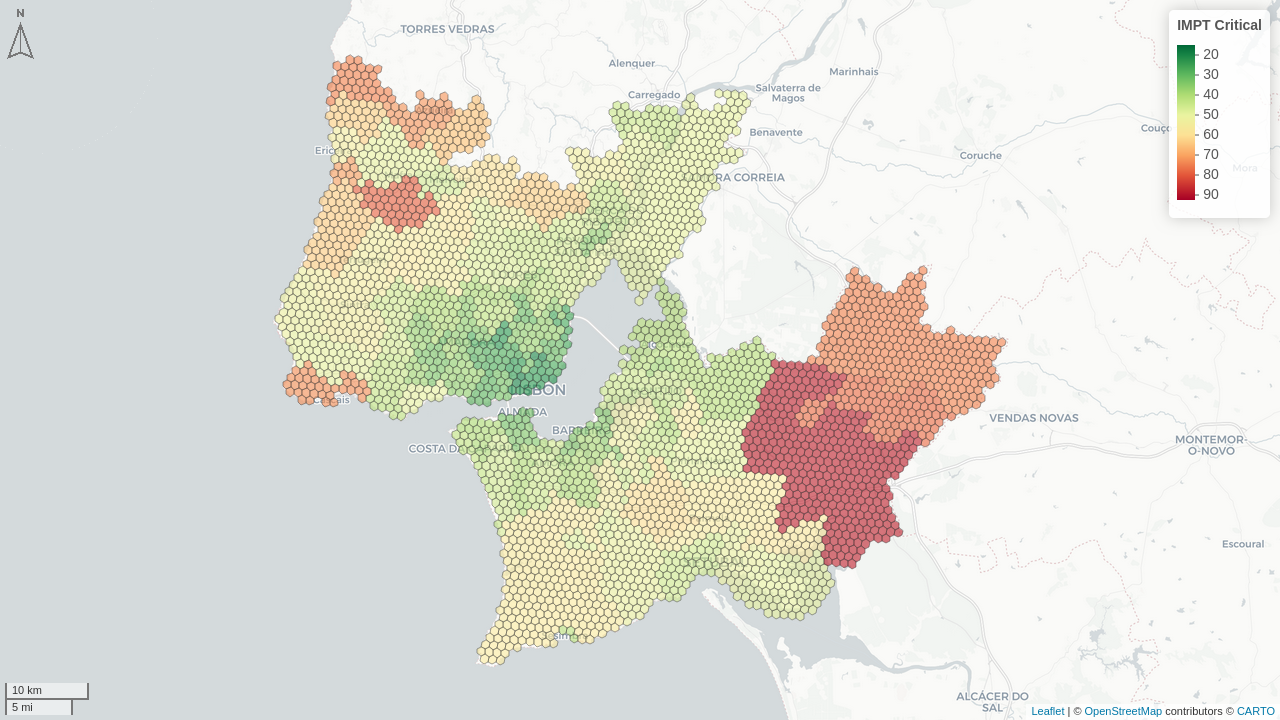
The geographic areas (Figure 1.2) used throughout the pipeline include three nested levels:
- Municipalities (municípios): 18 units
- Parishes (freguesias): 124 units (post-2013 and 2024 reform boundaries, updated to CAOP 2024)
- H3 Hexagonal Grid, Resolution 8 (primary unit for routing calculations): 3,686 hexagons, edge length ≈ 531 m, average area ≈ 0.74 km². This is a universal grid. (Uber Technologies 2018)
Several parishes changed between the 2016 IMOB travel survey, the Census 2021, and the CAOP 2024 boundaries. A conversion table and area-weighted redistribution procedure was applied to ensure consistency (see Section 4.2).

1.2 Conceptual Framework
The IMPT is structured around four dimensions, assessed across four transport modes:
| Dimension | Modes assessed |
|---|---|
| Accessibility | Car, PT1, Cycling, Walking |
| Mobility | Car, PT, Cycling, Walking |
| Affordability | Car, PT |
| Safety | Car, Cycling, Walking |
Each dimension is computed as a composite of multiple indicators, normalised to a [1–100] scale, and then aggregated using Principal Component Analysis (PCA) to produce a single dimensional score. An overall IMPT score is derived as the geometric mean (or entropy-weighted product) of the four dimension scores.
The next sections describe the data preparation, the calculation of each indicator, the PCA-based dimensional scores, and the final index construction.
PT: Public Transport↩︎