flowchart TB
    TTM["Travel Time Matrix<br/>5 modes × 2 transfer scenarios"] --> CumCut
    POIs["POIs per H3 cell<br/>(13 categories, spatially joined)"] --> CumCut
    Census["Population per H3 cell<br/>(residents, kids, elder, active)"] --> CumCut
    TTM --> CostCalc
    POIs --> CostCalc
    Census --> CostCalc

    subgraph CumCut["Cumulative Accessibility"]
        direction TB
        Loop1["For each POI category"] --> Loop2["For each transport mode"]
        Loop2 --> Loop3["For each time cutoff<br/>5,10,15,30,45,60,75,90 min"]
        Loop3 --> Calc1["accessibility::cumulative_cutoff()<br/>Count opportunities reachable<br/>within cutoff time"]
    end

    subgraph CostCalc["Cost to Closest"]
        direction TB
        Loop4["For each POI category"] --> Loop5["For each transport mode"]
        Loop5 --> Loop6["For each of the 1st, 2nd, and 3rd closest opportunity"]
        Loop6 --> Calc2["accessibility::cost_to_closest()<br/>Travel time to the 1st, 2nd, and 3rd closest opportunity"]
    end

    CumCut --> Agg["Aggregate to parish/municipality<br/>(weighted mean by population segment)"]
    CostCalc --> Agg
    Agg --> Out["Output: access\_{poi}\_{mode}\_{time}\_{census}"]
    Agg --> Out2["Output: mobility_cost\_{poi}\_{mode}\_{n}\_{census}"]
7 Accessibility
Accessibility indicators measure the spatial accessibility of opportunities for different population groups using two metrics: cumulative accessibility and travel time to the closest opportunities.
7.1 Cumulative accessibility
Script: 04_access_opportunities.R
Package: accessibility (Pereira and Herszenhut 2022)
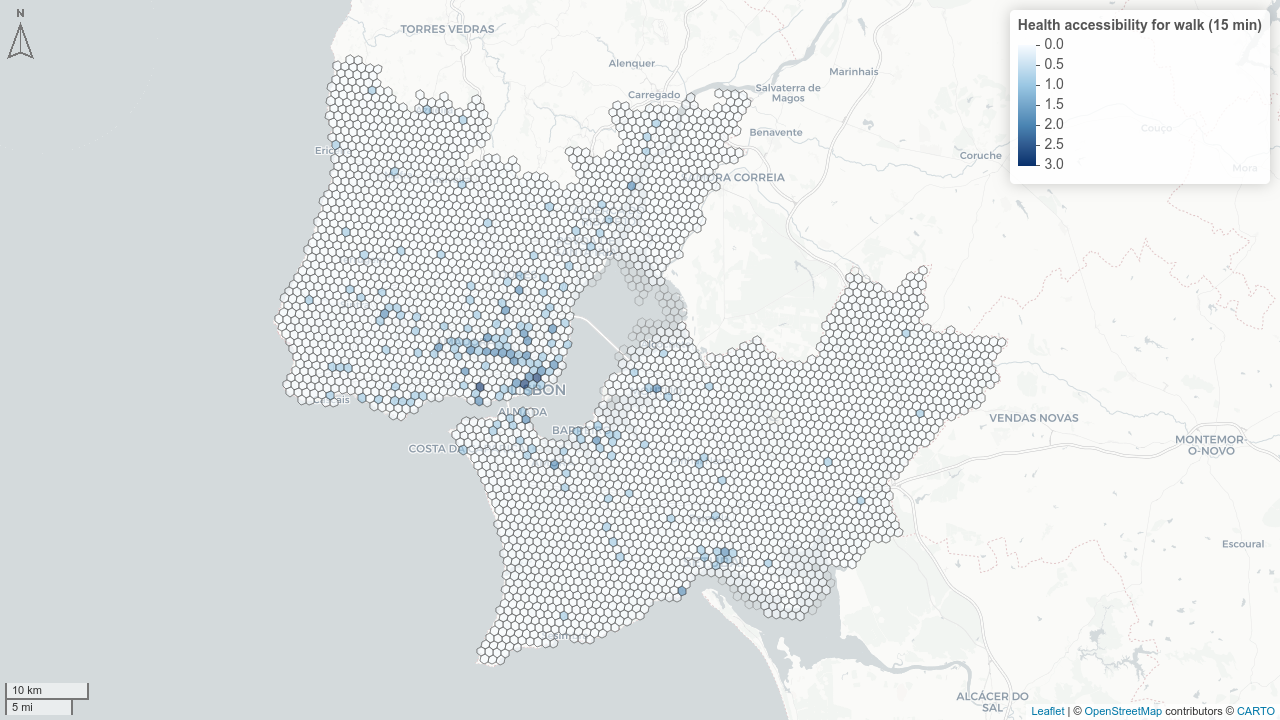
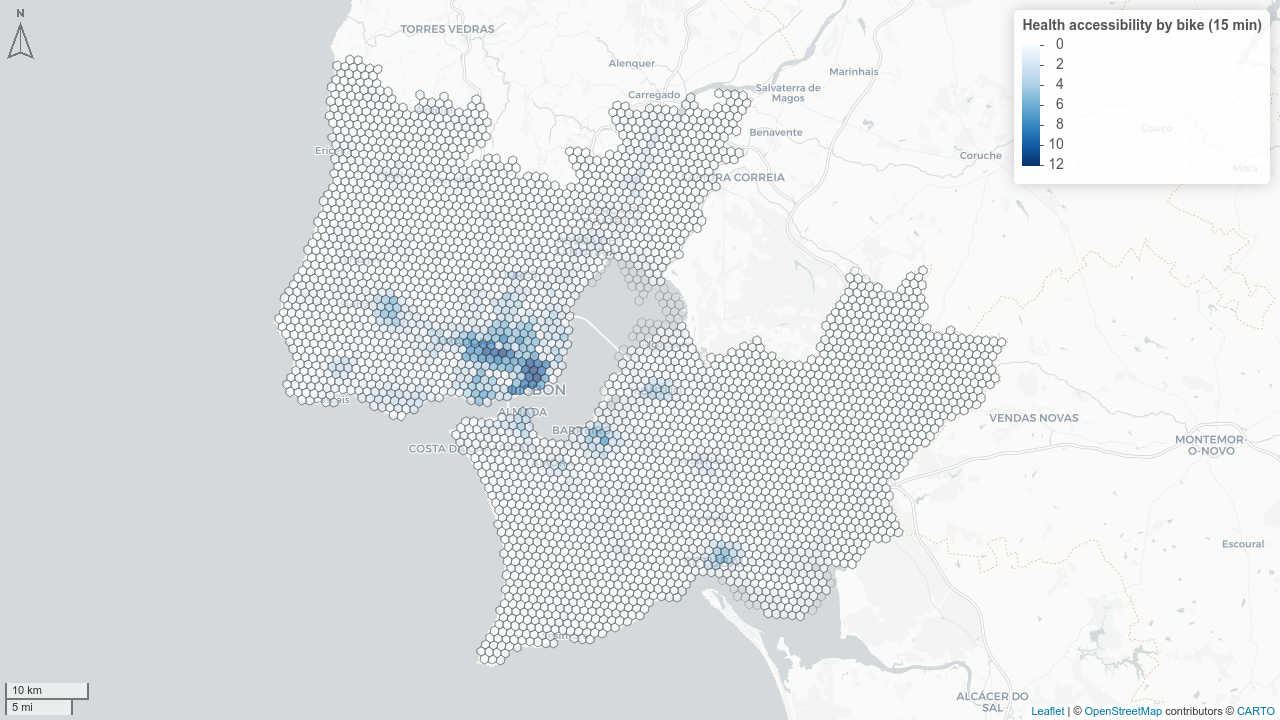
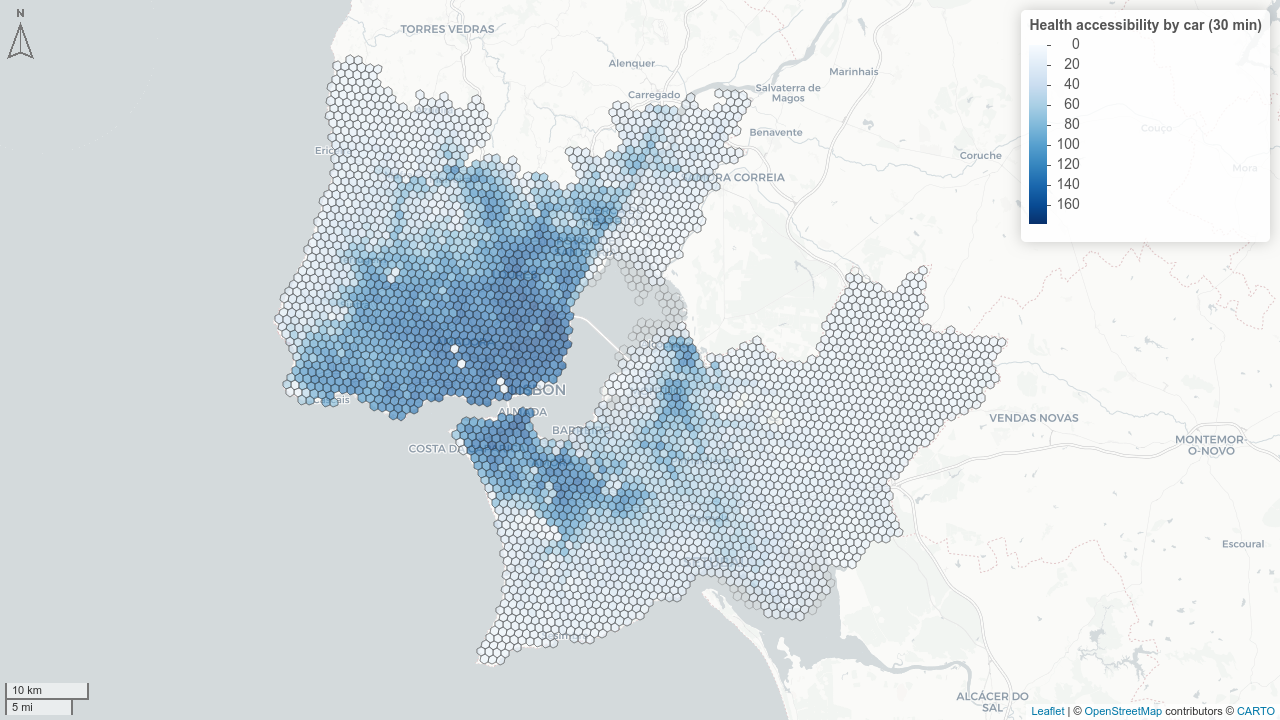
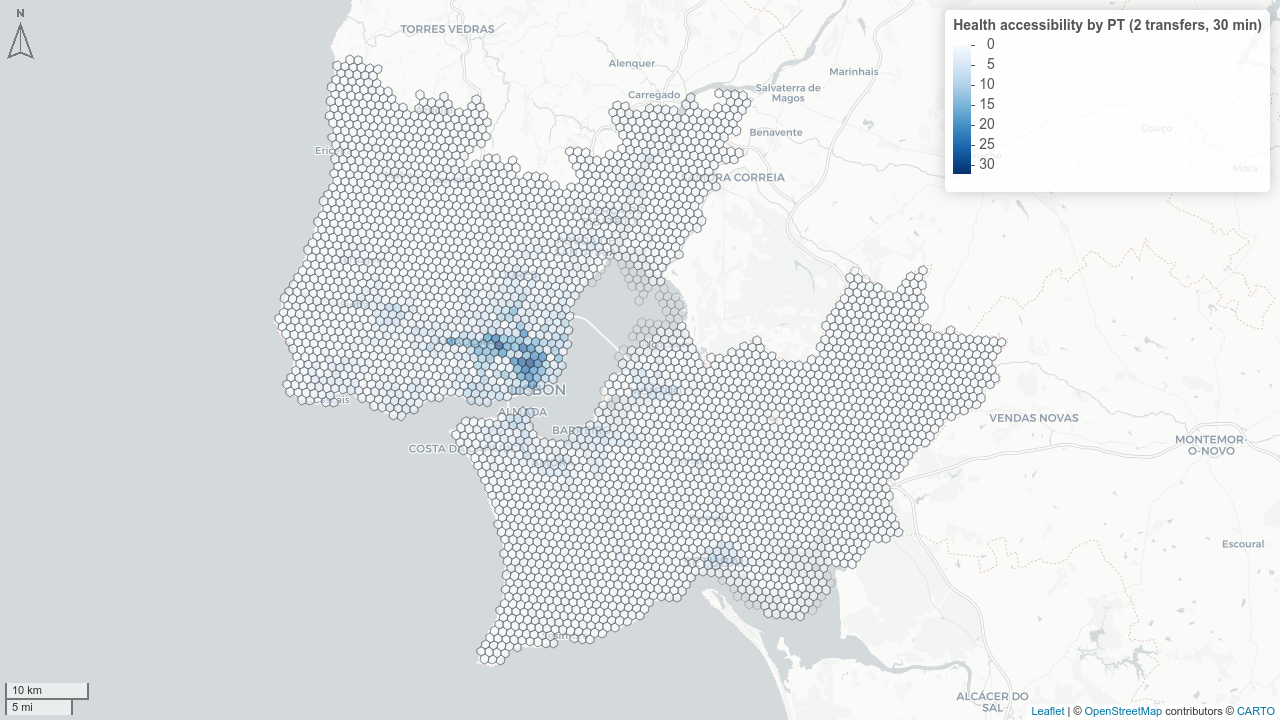
Cumulative accessibility, computed with accessibility::cumulative_cutoff(), measures the number of opportunities of each category reachable within a given travel time (example in Figure 7.2). It is computed considering different time cut-offs, to evaluate how the number of opportunities reachable increase with a progressively higher time budget.
The resulting values are then aggregated to parishes and municipalities using a population-weighted mean, separately for each demographic group (residents, kids, active, elderly).
Metric naming convention:
Accessibility metrics follow the pattern:
access_{poi_type}_{mode}_{time}_{census_group¹}
¹ Accessibility is computed at grid level, so metrics for this scale are not aggregated by census group.
For example: access_health_pt_30min_residents is the number of health facilities reachable by public transit within 30 minutes, for the total resident population for the parish and municipality levels. At the grid level, it is called access_health_pt_30min_residents.
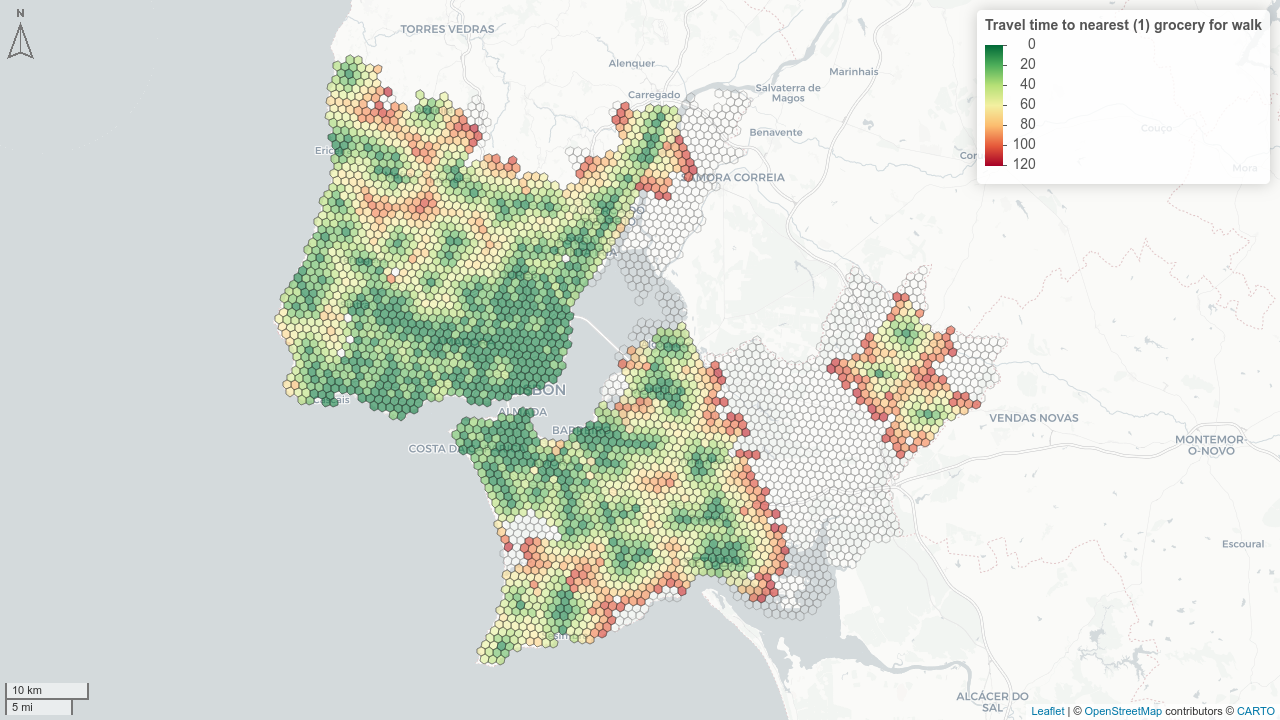
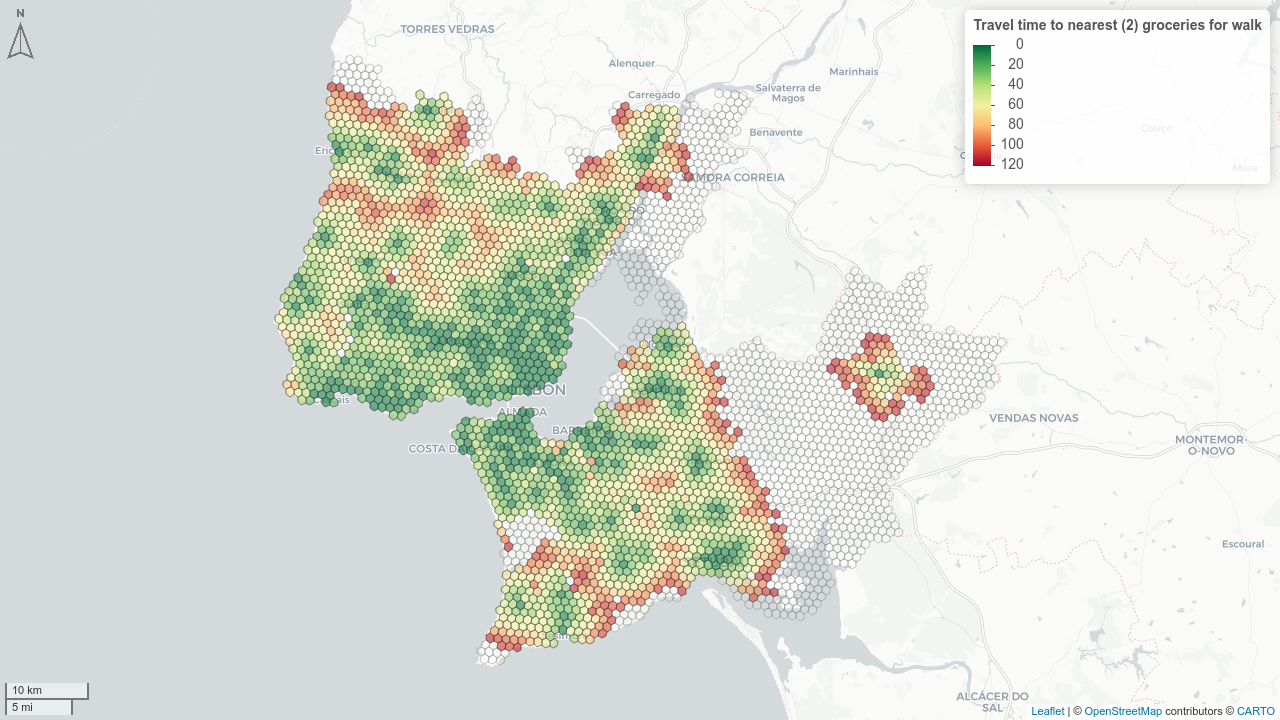
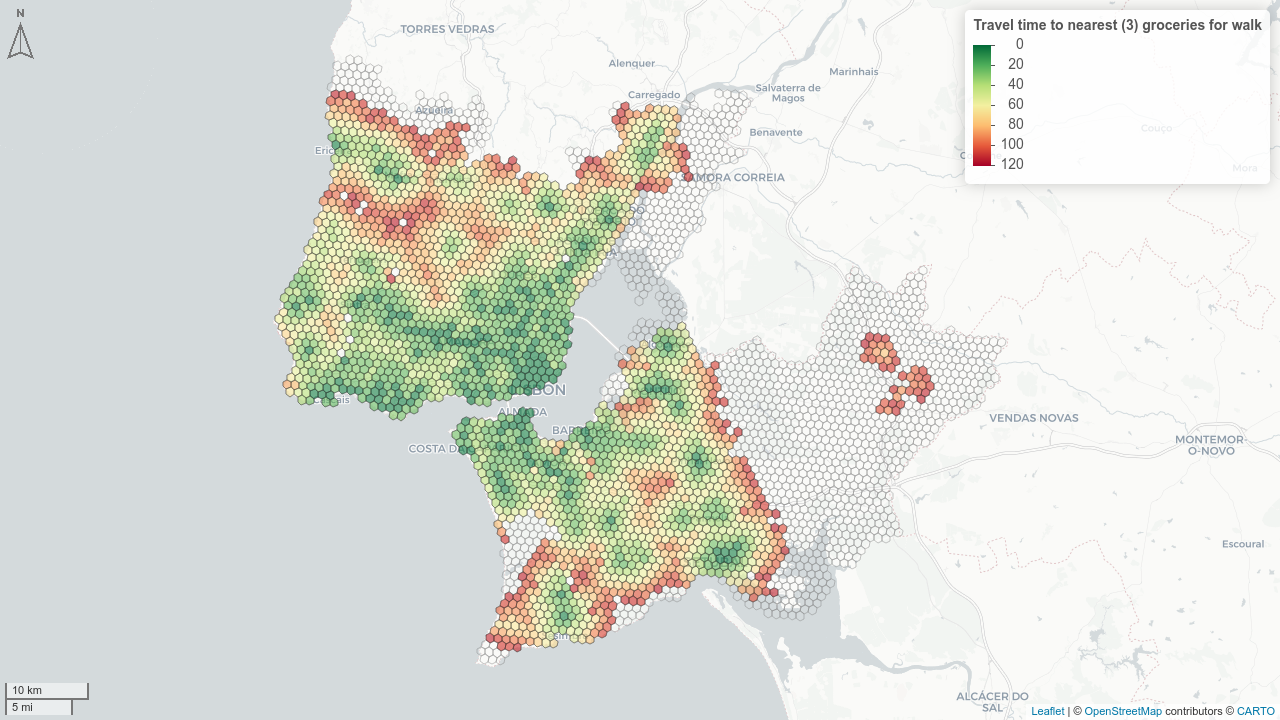
7.2 Time to closest opportunity (mobility costs)
Script: 04_mobility_costs_time.R
Package: accessibility (Pereira and Herszenhut 2022)
The time to closest opportunities is computed with accessibility::cost_to_closest() considering different number of closest opportunities (1, 2, and 3). This variations aims to determine how the travel time to the closest opportunity changes with a stricter criteria of opportunities considered (example in Figure 7.3).
The resulting values are then aggregated to parishes and municipalities using a population-weighted mean, separately for each demographic group (residents, kids, active, elderly).
Metric naming convention:
Accessibility metrics follow the pattern:
mobility_cost_{poi_type}_{mode}_{n}_{census_group¹}
¹ Accessibility is computed at grid level, so metrics for this scale are not aggregated by census group.
NotePOIs only inside Lisbon Metropolitan Area
Mind that the POIs considered to compute accessibility are limited to the Lisbon Metropolitan Area boundaries, so the values of accessibility in the border of the region might underestimate the reality.