Reading layer `TRIPSgeo' from data source `D:\GIS\EITcourse\data\TRIPSgeo.gpkg' using driver `GPKG'
Simple feature collection with 18 features and 7 fields
Geometry type: MULTIPOLYGON
Dimension: XY
Bounding box: xmin: -9.500527 ymin: 38.40907 xmax: -8.490972 ymax: 39.06472
Geodetic CRS: WGS 84
Code
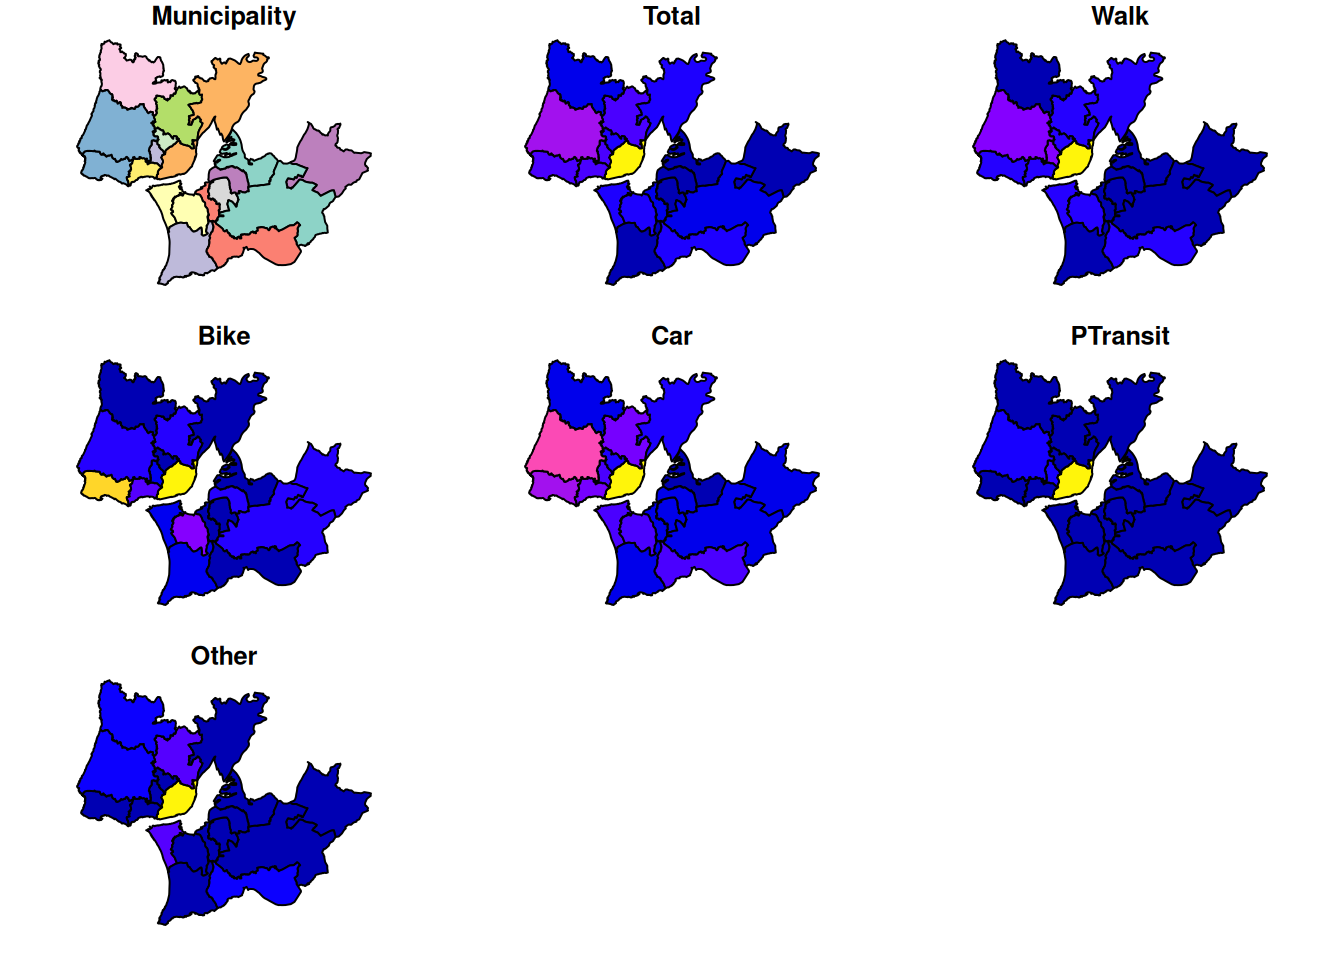
plot(TRIPSgeo)
Interactive maps are useful to explore the data, as you can zoom in and out, and click on the points to see the data associated with them.
There are several R packages to create interactive maps. For instance, the tmap package, the leaflet package, and the mapview package.
7.1 Mapview
Mapview allows to create quick interactive maps, only by declaring the function mapview().
Code
library(mapview)mapview(TRIPSgeo)
To color the points by a variable, you can use the zcol argument.
Code
mapview(TRIPSgeo, zcol ="Total")
As you can see, a color palette is automatically assigned to the continuous variable.
Try to use a categorical variable.
Code
mapview(TRIPSgeo,zcol ="Municipality", # depending on the variablealpha.regions =0.4, # also add transparencycolor ="white"# border color )
Note that you can change the basemap, and click on the geometries to see the data associated with them.
You can go crazy with all the options that mapview offers. Please refer to the documentation to see all the options.
7.1.1 Export
You can directly export the map as an html file or image, using the Viewer panel.
This is the most straightforward solution.
You can also export a map as an html file or image using code.
Code
# install.packages("webshot2") # you will need thismap =mapview(TRIPSgeo, zcol ="Total") # fisrt create a objet with the desired mapmapshot2(map, "data/map.html") # as webpagemapshot2(map, file ="data/map.png") # as image
7.2 Rmarkdown
To include a map on a report, website, paper (any type), you can create an Rmarkdown file.
And include a R code chunk (ctrl + alt + i) with a map. If the output is html, you will get an interactive map on your document!
Source Code
---format: pdf: prefer-html: true---# Interactive mapsYou can plot a static map using `plof(sf)`, but you can also create interactive maps.```{r}#| eval: false#| include: false# data preparationlibrary(sf)TRIPSgeo_mun =st_read("https://github.com/U-Shift/MQAT/raw/main/geo/TRIPSgeo_mun.gpkg")TRIPSgeo = TRIPSgeo_mun |>rename(Municipality ="Concelho") |>st_set_geometry("geometry")st_write(TRIPSgeo, "data/TRIPSgeo.gpkg", delete_dsn =TRUE)``````{r}#| message: falselibrary(sf)TRIPSgeo =st_read("data/TRIPSgeo.gpkg")plot(TRIPSgeo)```Interactive maps are useful to explore the data, as you can zoom in and out, and click on the points to see the data associated with them.There are several R packages to create interactive maps.For instance, the `tmap` package, the `leaflet` package, and the `mapview` package.## MapviewMapview allows to create quick interactive maps, only by declaring the function `mapview()`.```{r}#| fig-format: pnglibrary(mapview)mapview(TRIPSgeo)```To color the points by a variable, you can use the `zcol` argument.```{r}#| fig-format: pngmapview(TRIPSgeo, zcol ="Total")```As you can see, a color palette is automatically assigned to the **continuous variable**.Try to use a **categorical variable**.```{r}#| eval: false#| code-fold: truemapview(TRIPSgeo,zcol ="Municipality", # depending on the variablealpha.regions =0.4, # also add transparencycolor ="white"# border color ) ```::: {.callout-note appearance="simple"}Note that you can change the **basemap**, and click on the geometries to **see the data** associated with them.:::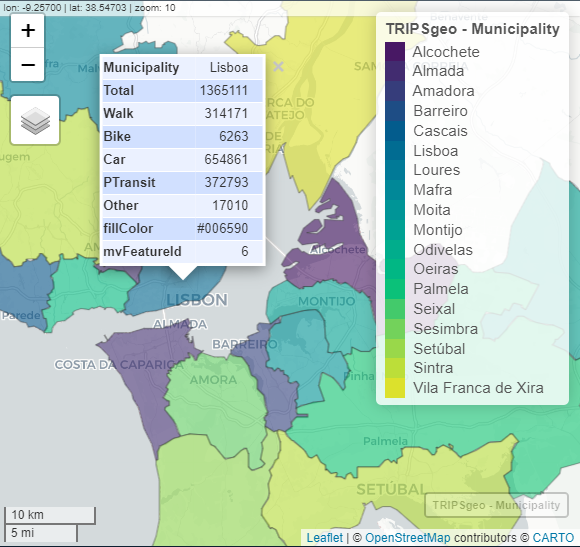{width="540"}You can go crazy with all the options that `mapview` offers.Please refer to the [documentation](https://r-spatial.github.io/mapview/articles/mapview_02-advanced.html) to see all the options.### ExportYou can directly export the map as an `html` file or image, using the Viewer panel.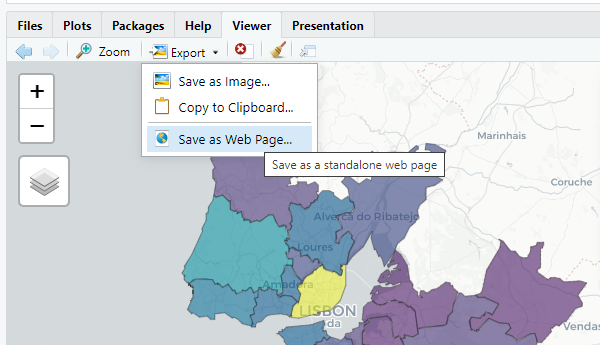{width="470"}::: {.callout-warning appearance="minimal" icon="false"}This is the most straightforward solution.:::You can also export a map as an html file or image using code.```{r}#| eval: false# install.packages("webshot2") # you will need thismap =mapview(TRIPSgeo, zcol ="Total") # fisrt create a objet with the desired mapmapshot2(map, "data/map.html") # as webpagemapshot2(map, file ="data/map.png") # as image```## RmarkdownTo include a map on a report, website, paper (any type), you can create an Rmarkdown file.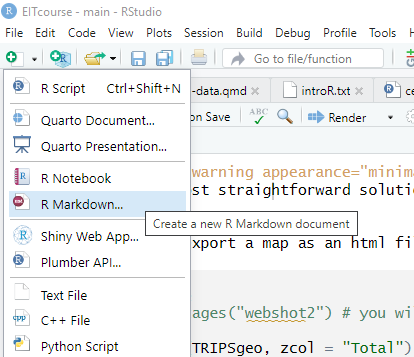{width="388"}And include a R code chunk (`ctrl + alt + i`) with a map.If the output is html, you will get an interactive map on your document!