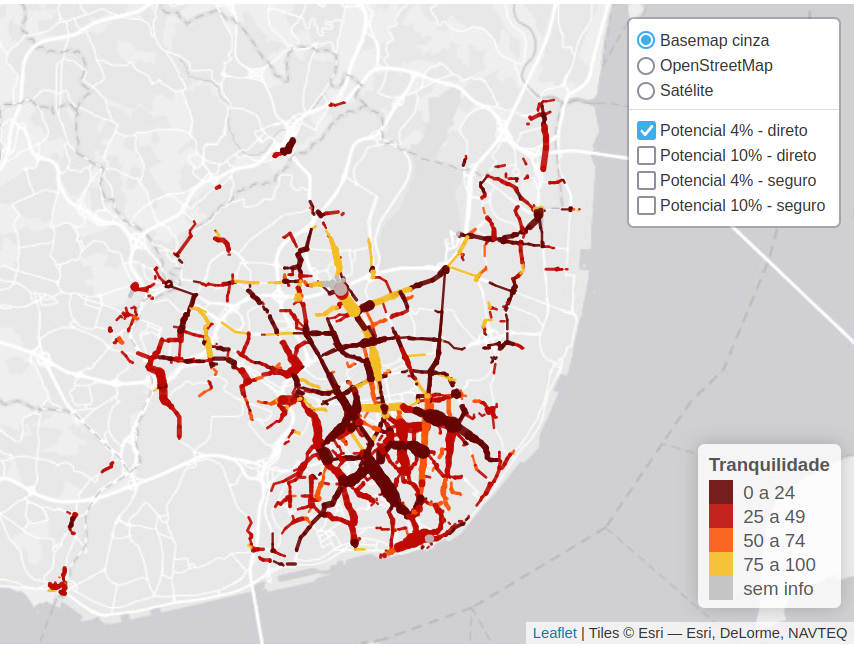
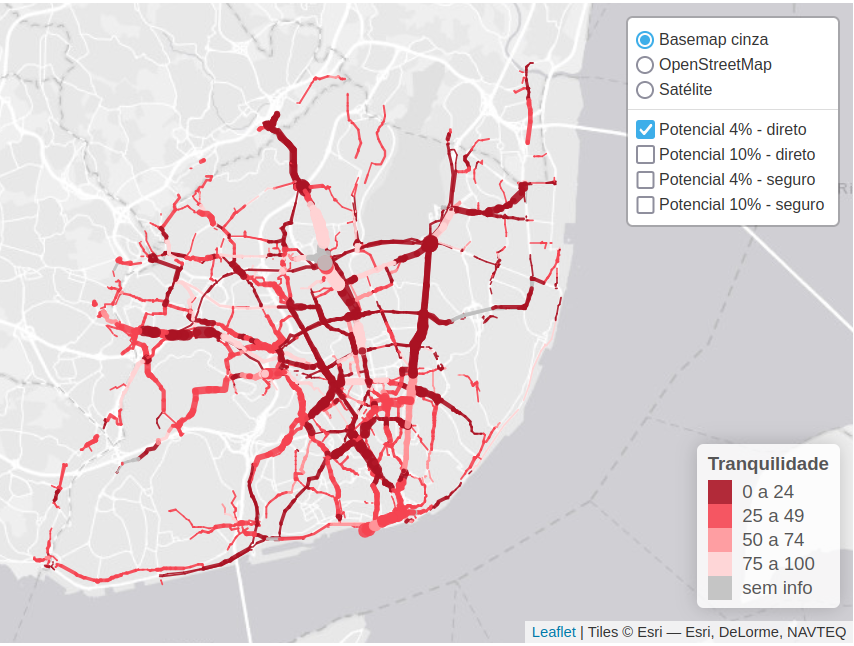
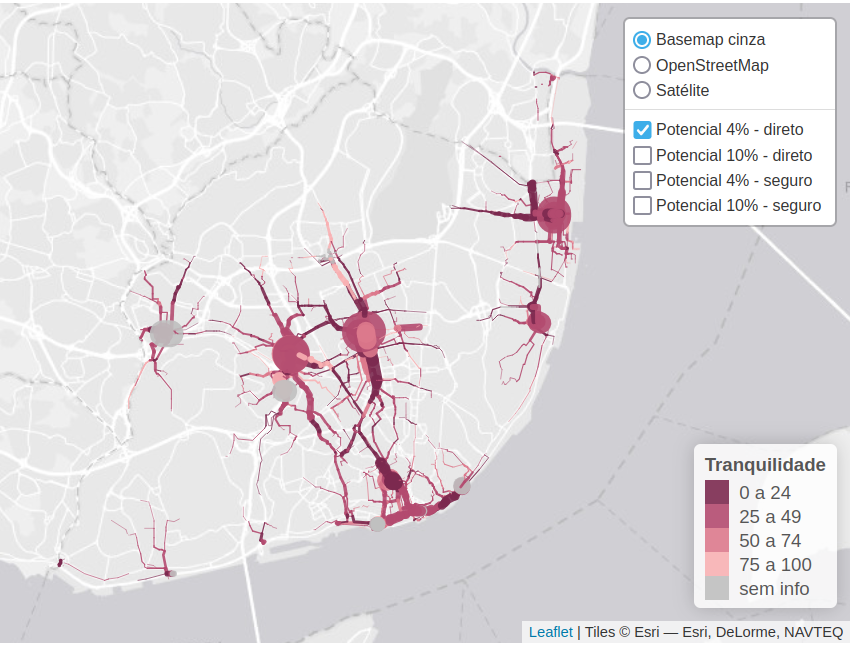
biclaR is a tool for the design and assessment of different scenarios of the cycling network models in the Lisbon metropolitan area (LMA). The web application can be found at u-shift.github.io/biclarwww.
biclaR is an open source project, see the source code on github.com/U-Shift/biclar.
For a description of the methods and research underlying the project, see the paper “Reproducible methods for modeling combined public transport and cycling trips and associated benefits: Evidence from the biclaR tool” published in Computers, Environment and Urban Systems (Félix, Moura, and Lovelace 2025), and the methodological report [PT] on the TML website.
Input data
The key datasets are as follows:
- Trips dataset with Origin and Destination, at Freguesia level, disaggregated by transport mode, from Instituto National de Estatística (2018)
- CAOP 2020 - Official limits of Portuguese areas.
- Road network from OpenStreetMap
- Main public transport interfaces at Lisbon Metropolitan Area, provided by Transportes Metropolitanos de Lisboa
Cenarios for cycling uptake
Baseline
The baseline scenario makes use of the 2018 mobility survey data in LMA.
We considered all trips between Freguesias.
See vignette baseline scenario to see how this was modeled.
ENMAC targets
The National targets for cycling uptake were set to:
- 4% of all trips should be made by bicycle by 2025
- 10% of all trips should be made by bicycle by 2030
Cycling trips should replace car trips directly.
See vignette ENMAC scenario to see how this was modeled.
Intermodal trips
See vignette Intermodal scenario to see how this was modeled.
E-bikes investment policy
See vignette E-bike scenario to see how this was modeled.
Methods
PCT - Propensity to Cycle Tool
biclar uses the methods developed in PCT.bike (Lovelace et al. 2017) for cycling uptake estimation and data visualization.
Jittering
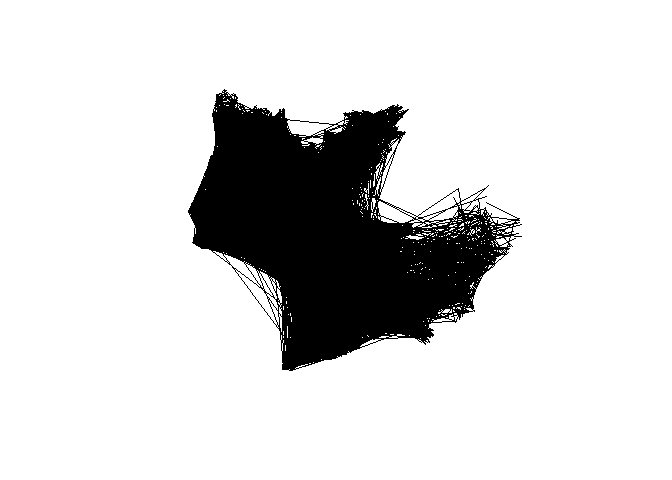
For the disagregation of OD pairs at Freguesias level, we use OD Jittering (Lovelace, Félix, and Carlino 2022) method, which better suits walking and cycling trips modelling (shorter distances), instead of relying on centroids that concentrate all the trips between areas.
The OD datasets, before and after jittering, are shown below.

Cycling routes
Use of CyclingStreets.net (R package) for fast and quiet bike routes for baseline scenario.
For e-bike scenario, we developed a proper algorithm, considering the topography, and using slopes package.
Intermodal trips
We made use and developed a methodology that considers replacing long trips by bike + train or ferry trips.
Estimation of socioeconomic benefits
Health Economic Assessment Tool (HEAT v5.0) for walking and cycling by WHO.
Results
Comparision with the cycling network plans by Municipality
Compare the modeled cycling networks (segments overlapping) with expansion plans, by municipality.
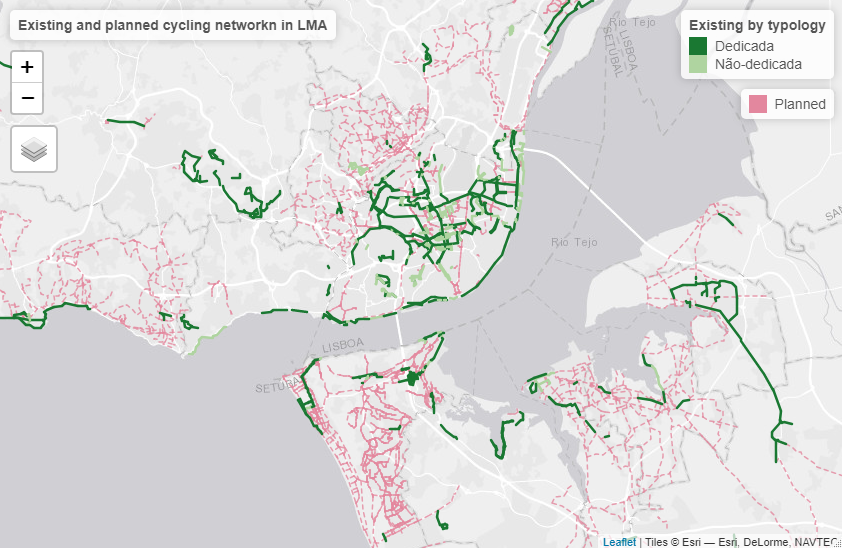
We can view it in an interactive map here.
Funding
This project is funded by TML - Transportes Metropolitanos de Lisboa.
