


From Isolation to Inclusion
Introducing the Multidimensional Transport Poverty Index tool


November 2nd 2026 — Equity in Transport Workshop, Barcelona
What is Missing?
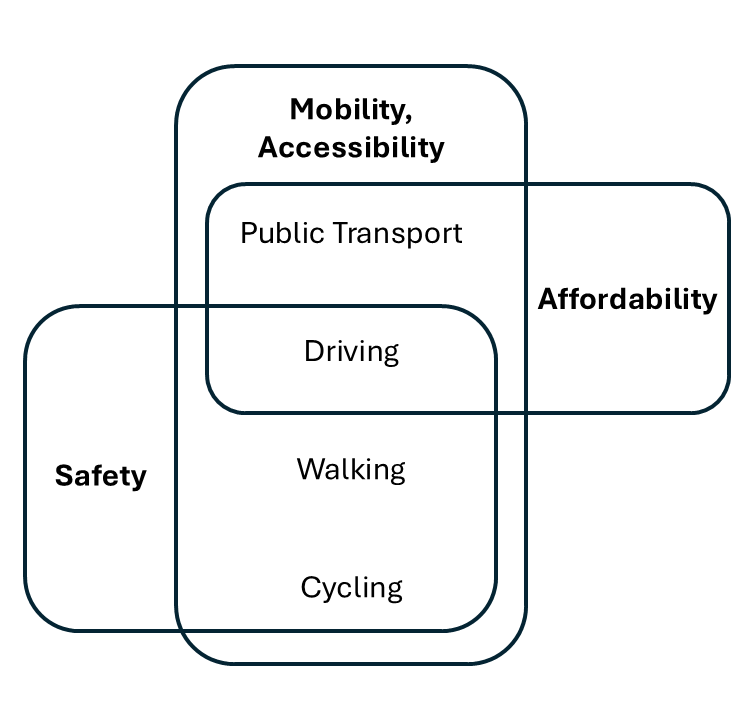
- ❌ No composite index integrating all 4 dimensions, across multiple transport modes
- ❌ Existing indexes rely on costly primary data (surveys)
- ❌ No operational tool translating research into policy support
👉 We wanted to create an index
Multi-dimentional · Multi-modal · Scalable · Replicable
Case Study: Lisbon Metropolitan Area
- Polycentric structure (strong employment / opportunities core in Lisbon)
- Strong urban/peripheral PT supply contrast
- High car modal share in periphery
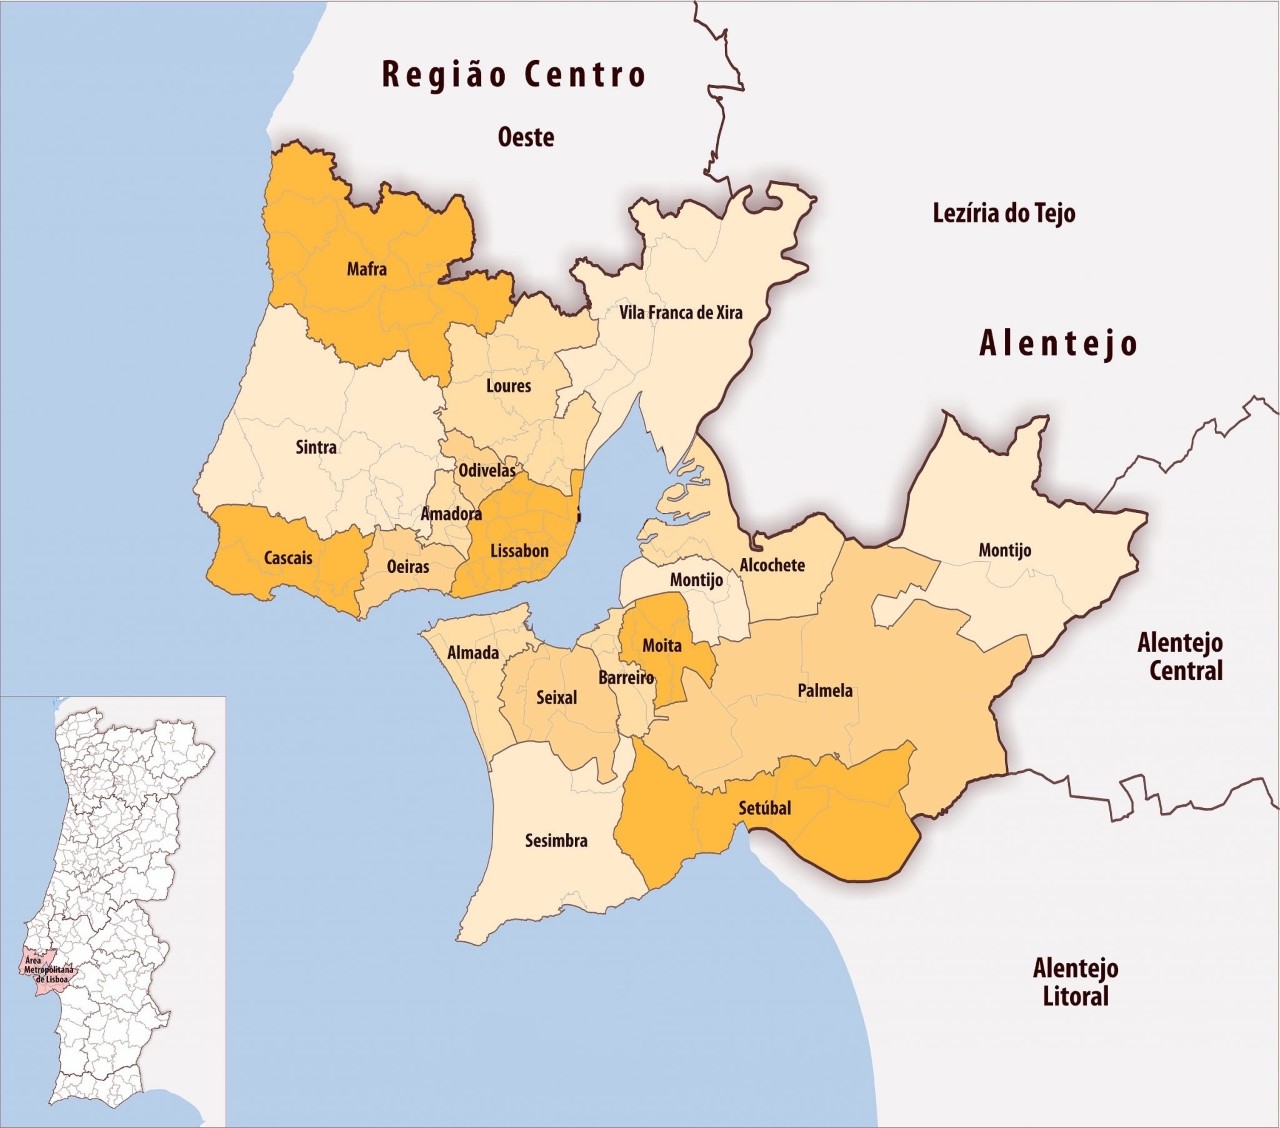
- 18 municipalities · 124 parishes · ~2.8M inhabitants, 3,000 km²
- Analysis unit: freguesia (parish) — lowest admin level with full data coverage
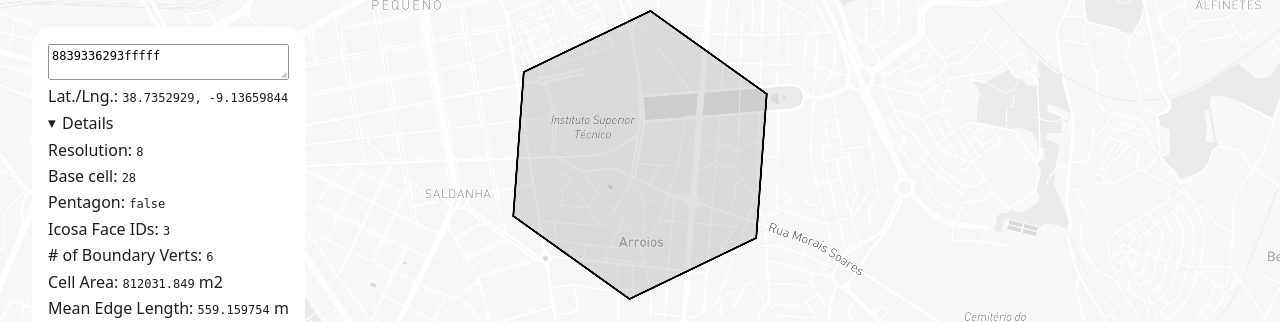
- Also computed at municipality and H3 grid level, resolution 8 (~3,686 hexagons)
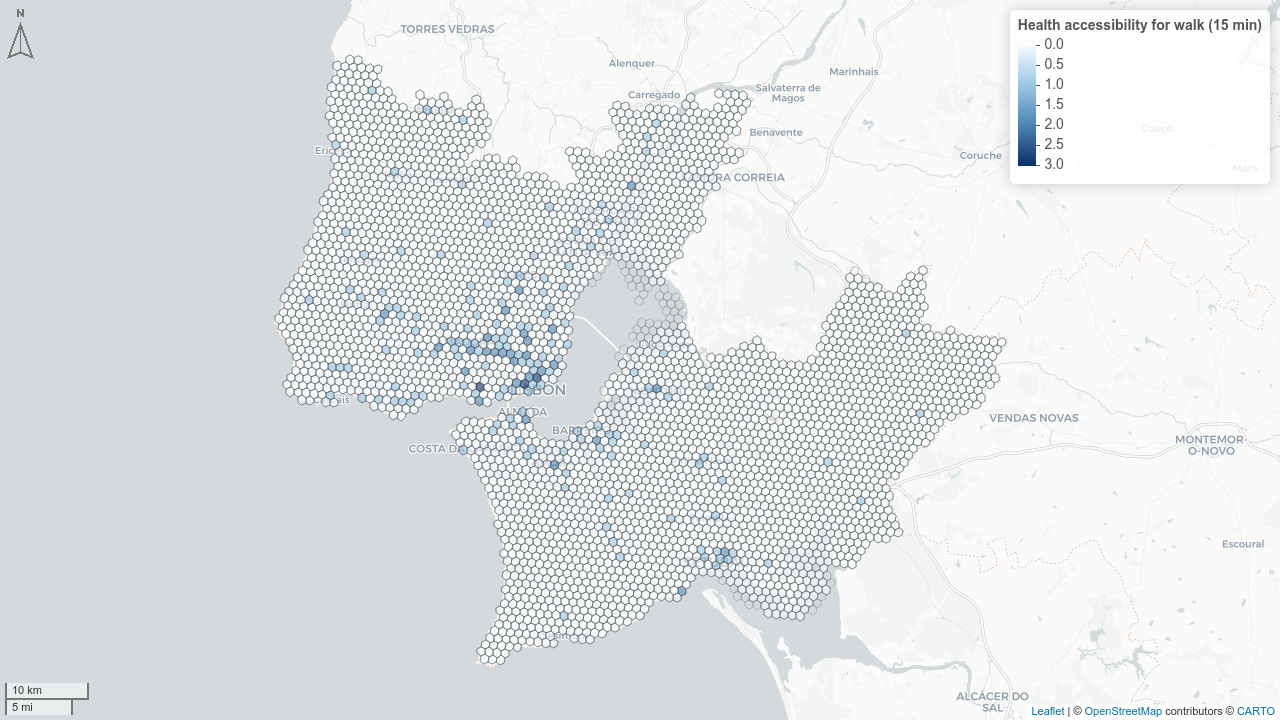
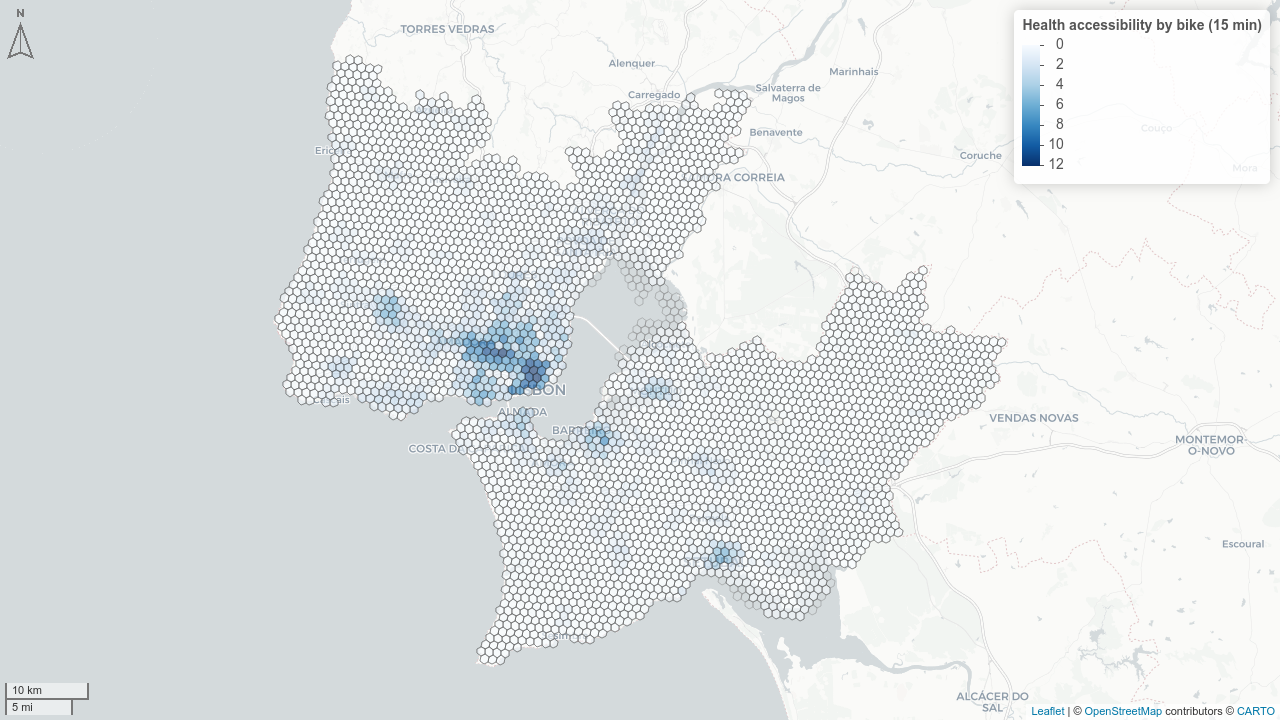
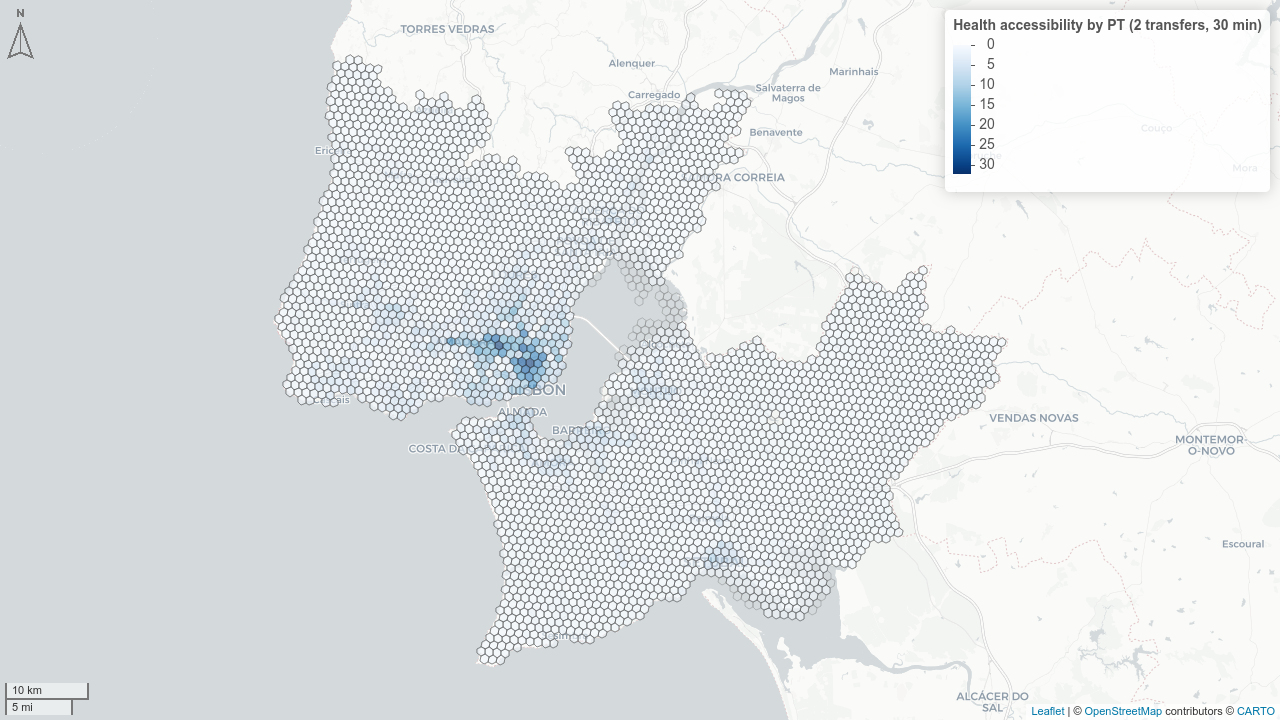
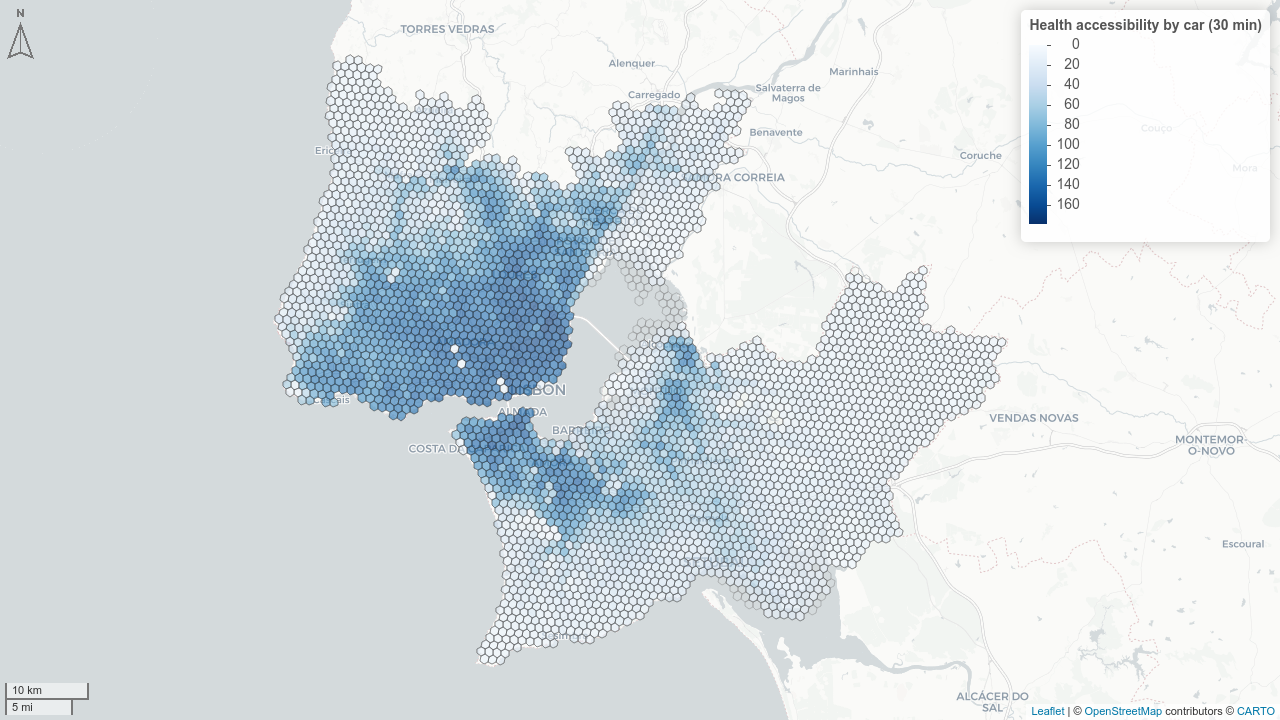
Computing Accessibility
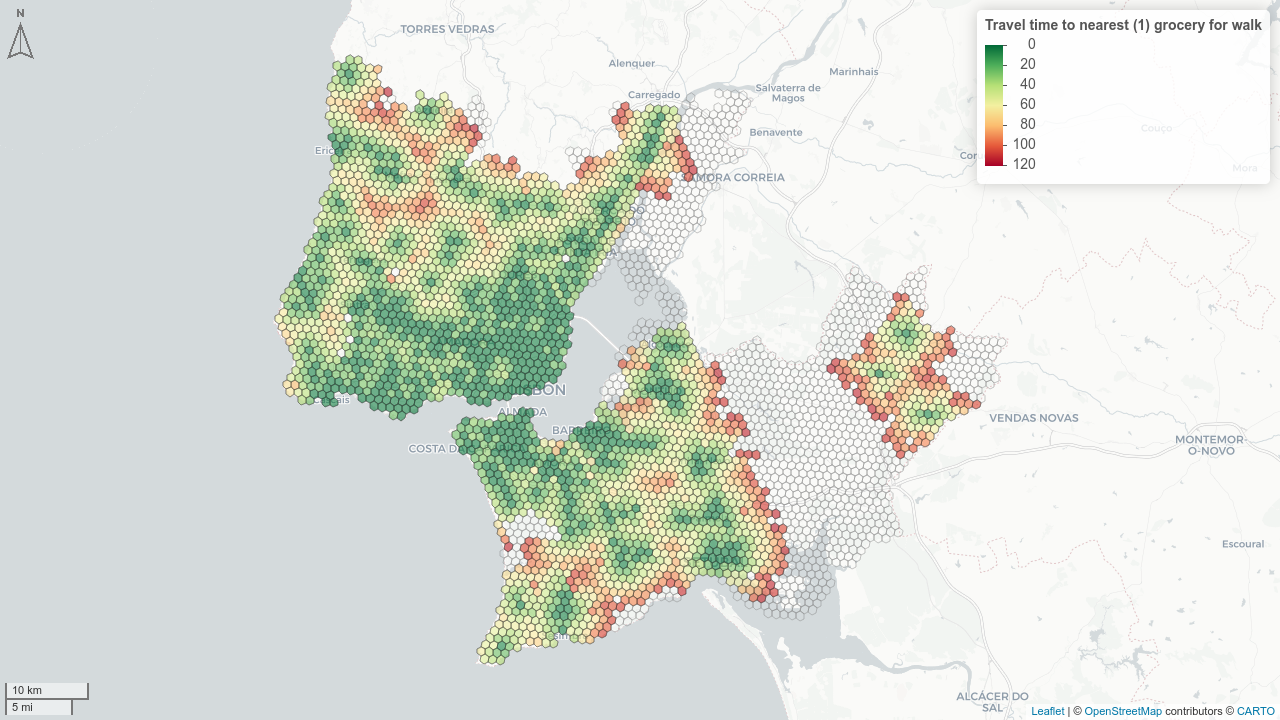
- Travel time matrix for all modes × all H3 res 8 grid cells
- 📍 Points of interest: healthcare, schools, groceries, green spaces, recreation, jobs
Computing Mobility
Systemic quality of the transport system:
- ⌛💼 Average commuting time (by mode)
- 🔁 Average transfers (public transport)
- 🕑 PT headways (peak / off-peak / night / weekend)
- 🚏 PT population coverage (walking isochrones to stops)
- 🚴 Cycling and pedestrian infrastructure ratio (from OSM)
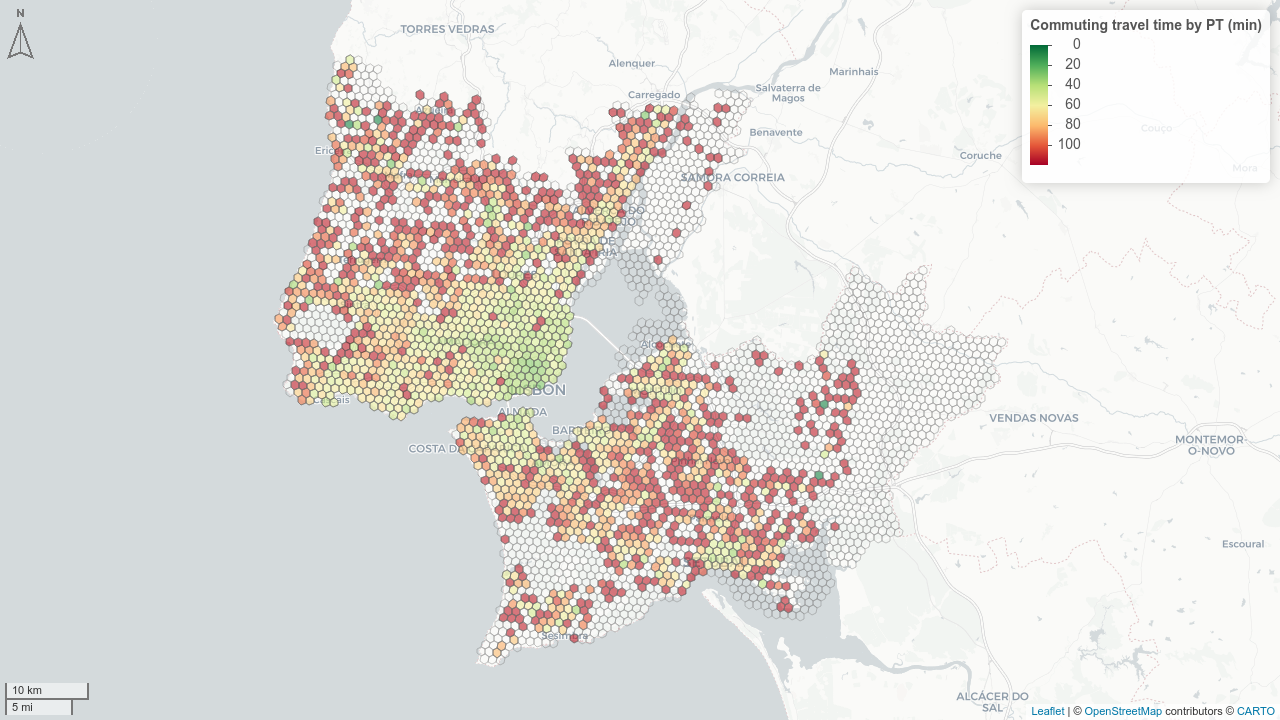
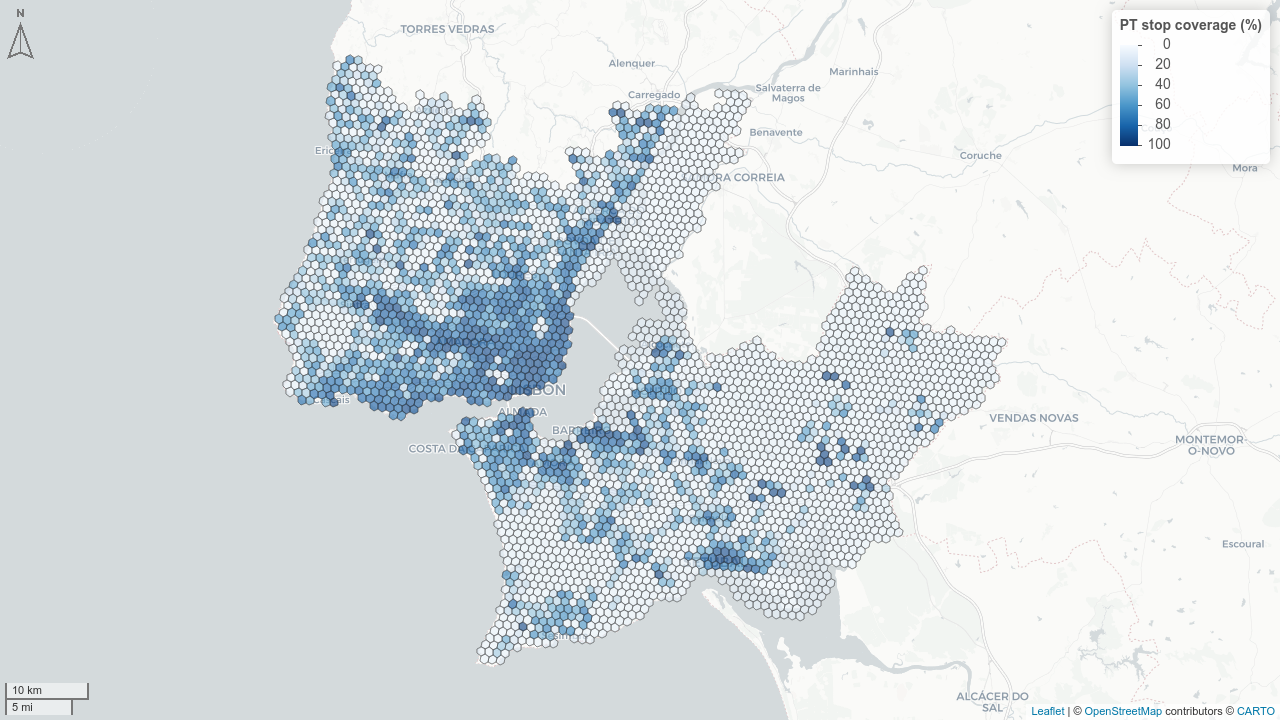
Computing Affordability
“Housing + transport costs ≤ 45% of income” threshold (Isalou et al. 2014; Litman 2026)
\[transp\_inc\_comp = \frac{HH_{size} \cdot P_{mobile}}{I_{household}} \cdot \left[\frac{C_{car,day}}{O} \cdot \frac{s_{car}}{\Sigma s} + C_{PT,day} \cdot \frac{s_{PT}}{\Sigma s}\right] \cdot N_{working\_days}\]
- Car cost: €0.40/km + tolls (via Infraestruturas de Portugal routing)
- PT cost: single ticket (~€1.91) or monthly pass Navegante (~€25.25/month)
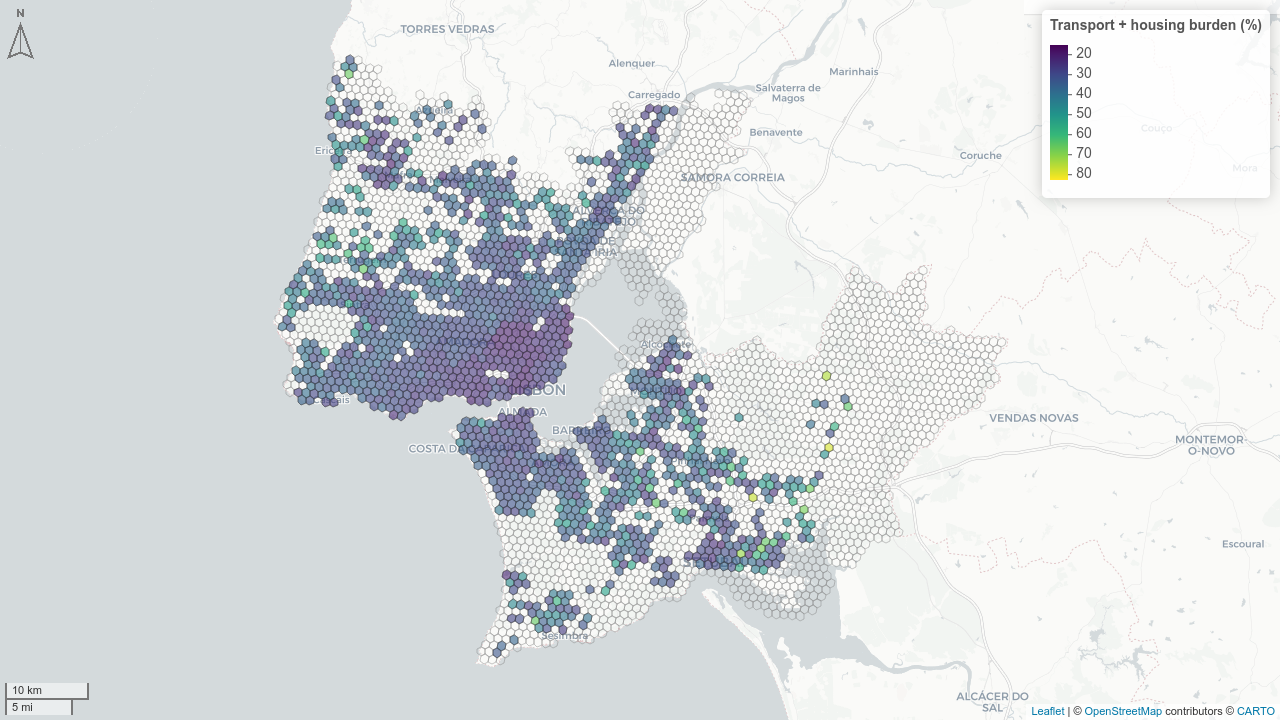
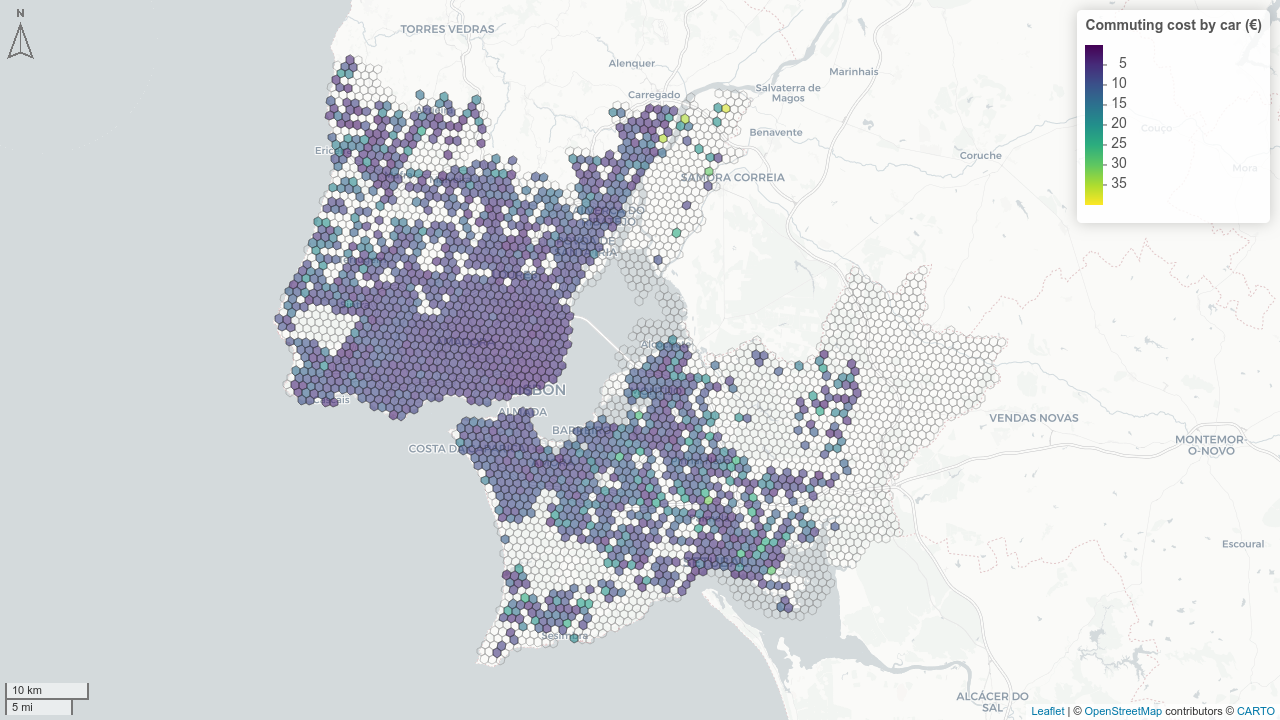
Computing Safety
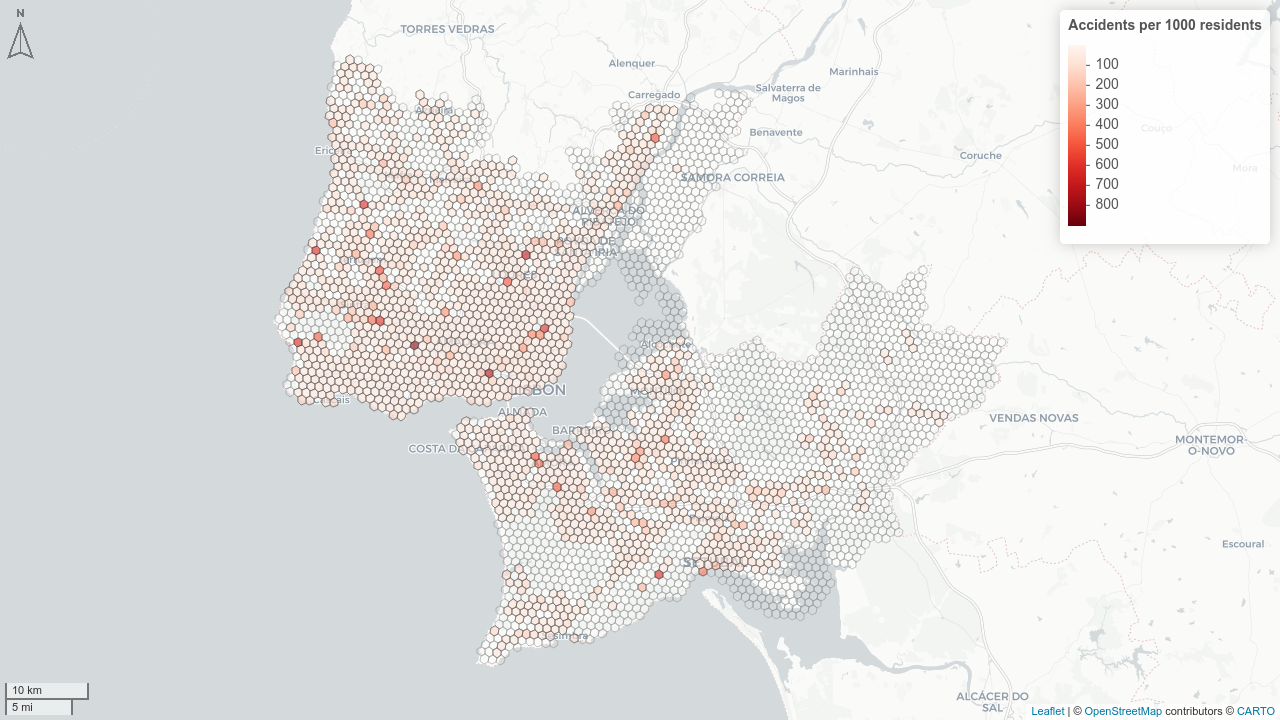
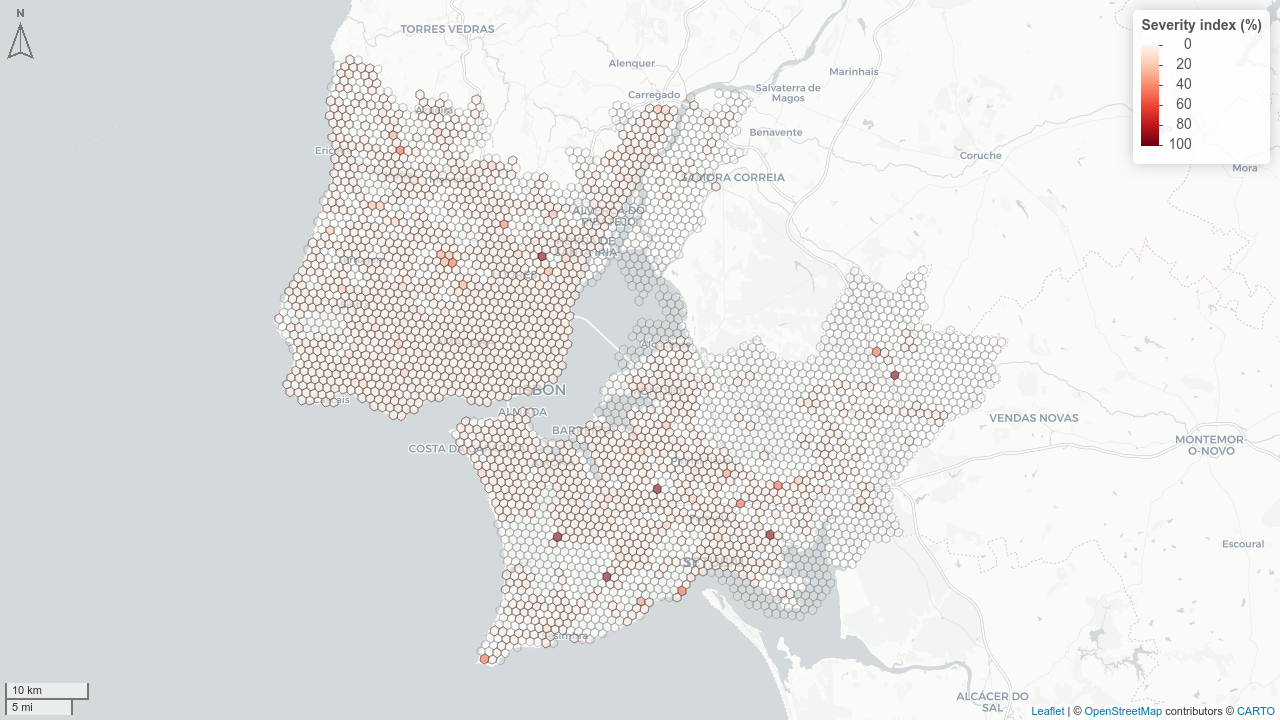
Based on ANSR road accident data (2019–2023), within-locality crashes only:
| Indicator | Formula |
|---|---|
| Accident rate | \(\sum Acc_{5y} / Pop \times 1000\) |
| Fatality rate | \(\sum MV_{30d} / Pop \times 1000\) |
| Severity index | \(\sum MV_{30d} / \sum Victims_{5y}\) |
| Mode-specific severity | fatalities / vehicles of that mode involved |
Dashboard: 🎮 Live Demo
Available at:
🔗 ushift.pt/apps/impt
Features:
- 🗺️ Interactive maps at parish, municipality & grid scales
- 📊 All dimensions × transport modes × indicators
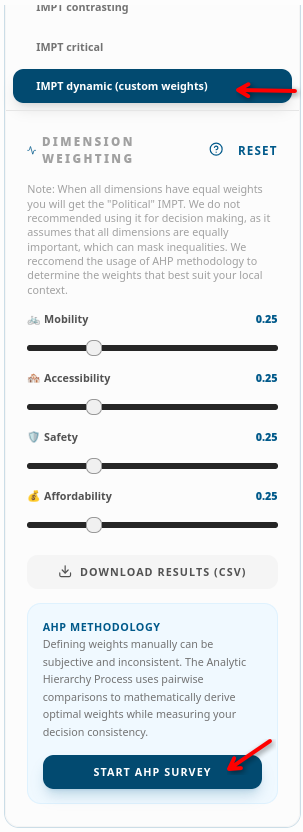
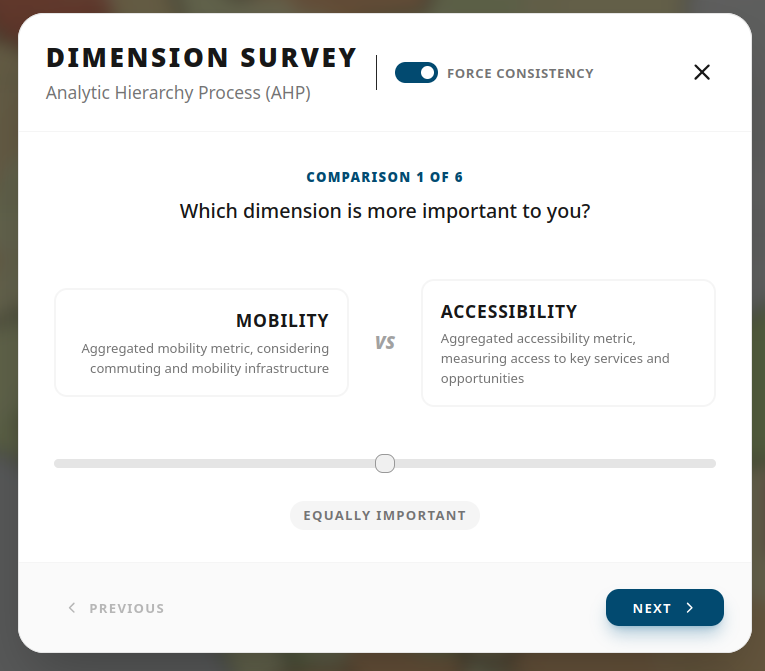
- ⚙️ Political IMPT: user-defined AHP weights
- 📥 Downloadable results (>1700 indicators)
🗺️ Accessibility
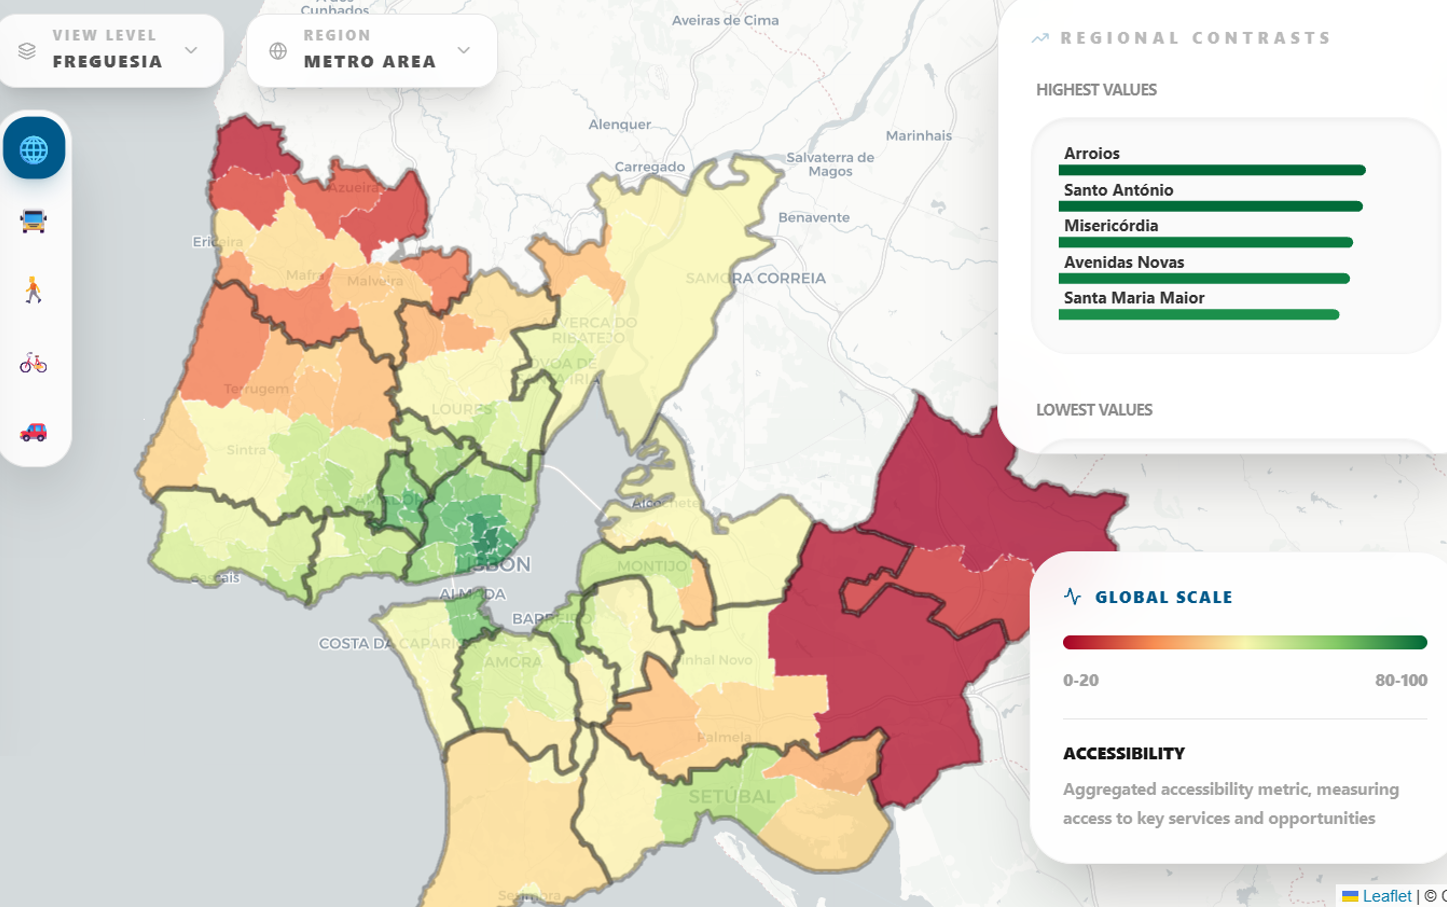
- High accessibility in the center
- Deficiencies concentrated in rural/low-density areas
🚌 Mobility
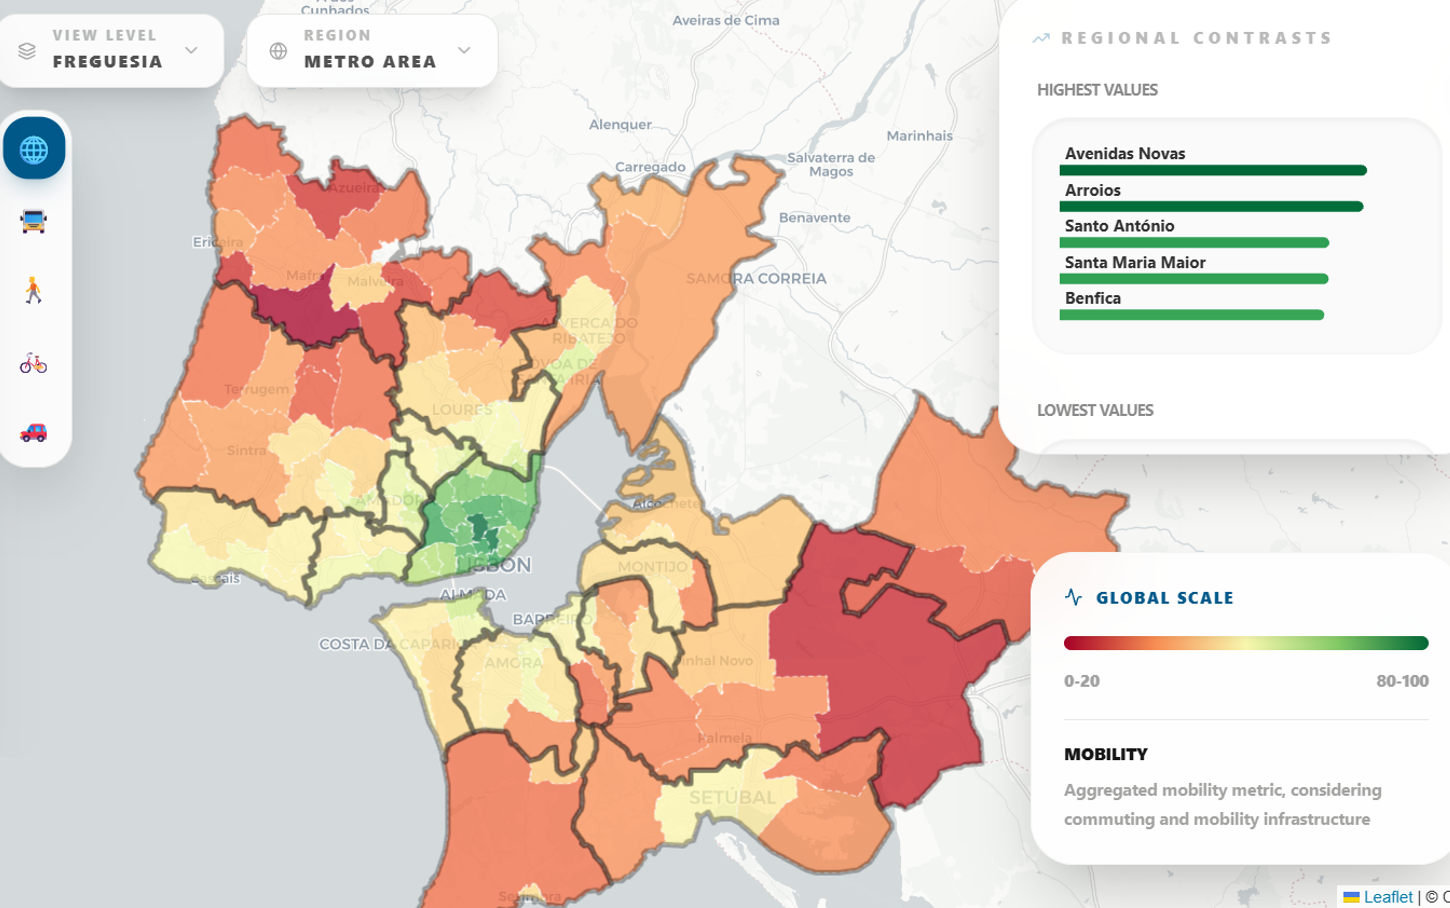
- Low scores in most AML except the center
- Periphery is severely underserved
- Highlights the centripetal structure of the LMA
Mobility justice?
💶 Affordability
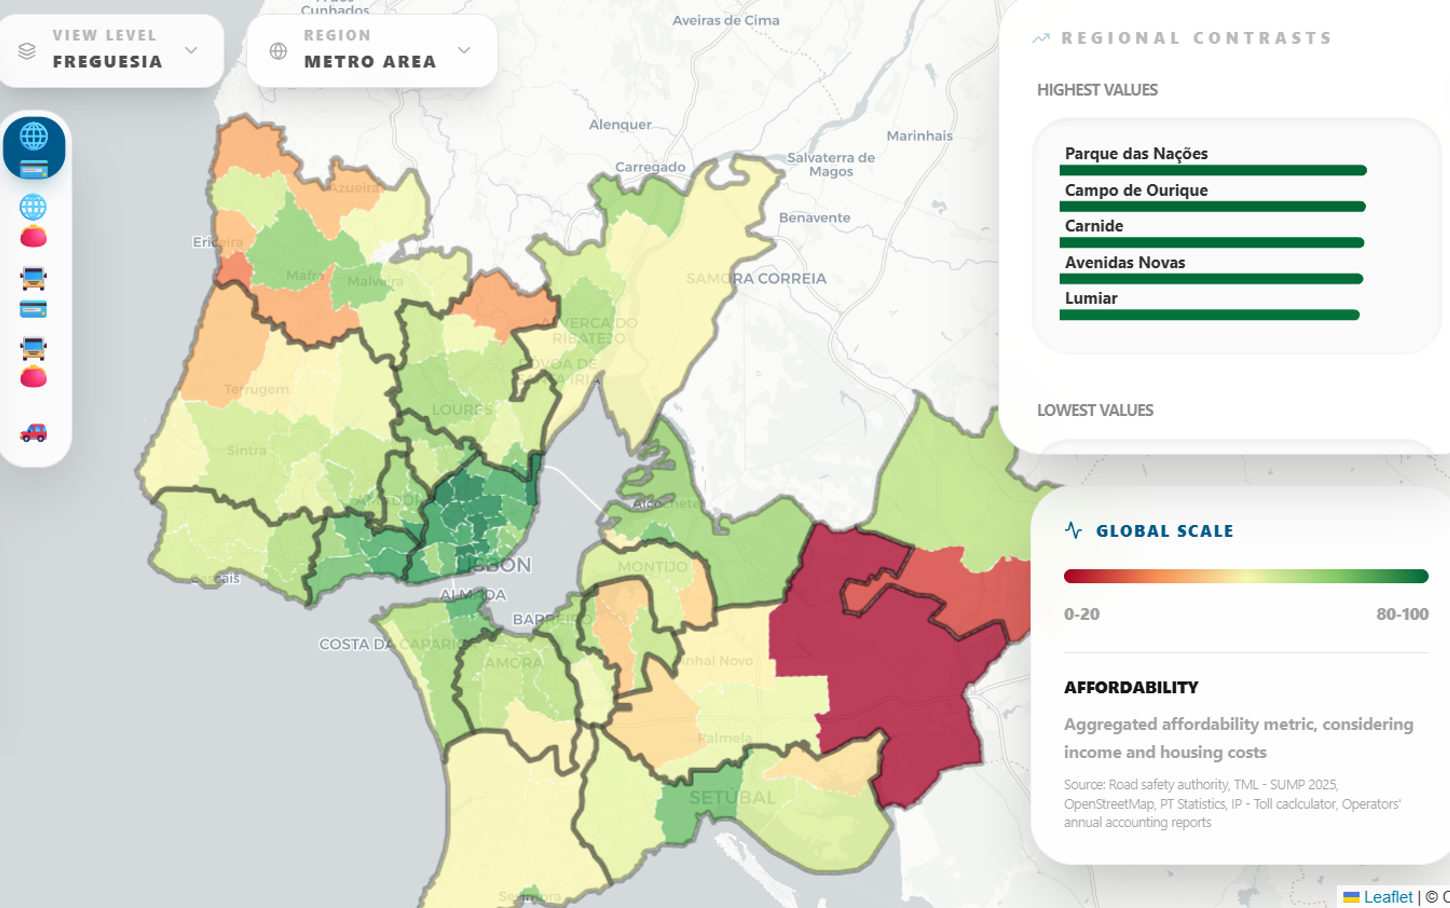
- High scores overall
- The Navegante monthly pass greatly mitigates costs (inexpensive)
- Worst cases in low-income, car-dependent areas
- Paradox: Housing more expensive where Transportation is more affordable and vice-versa
🦺 Safety
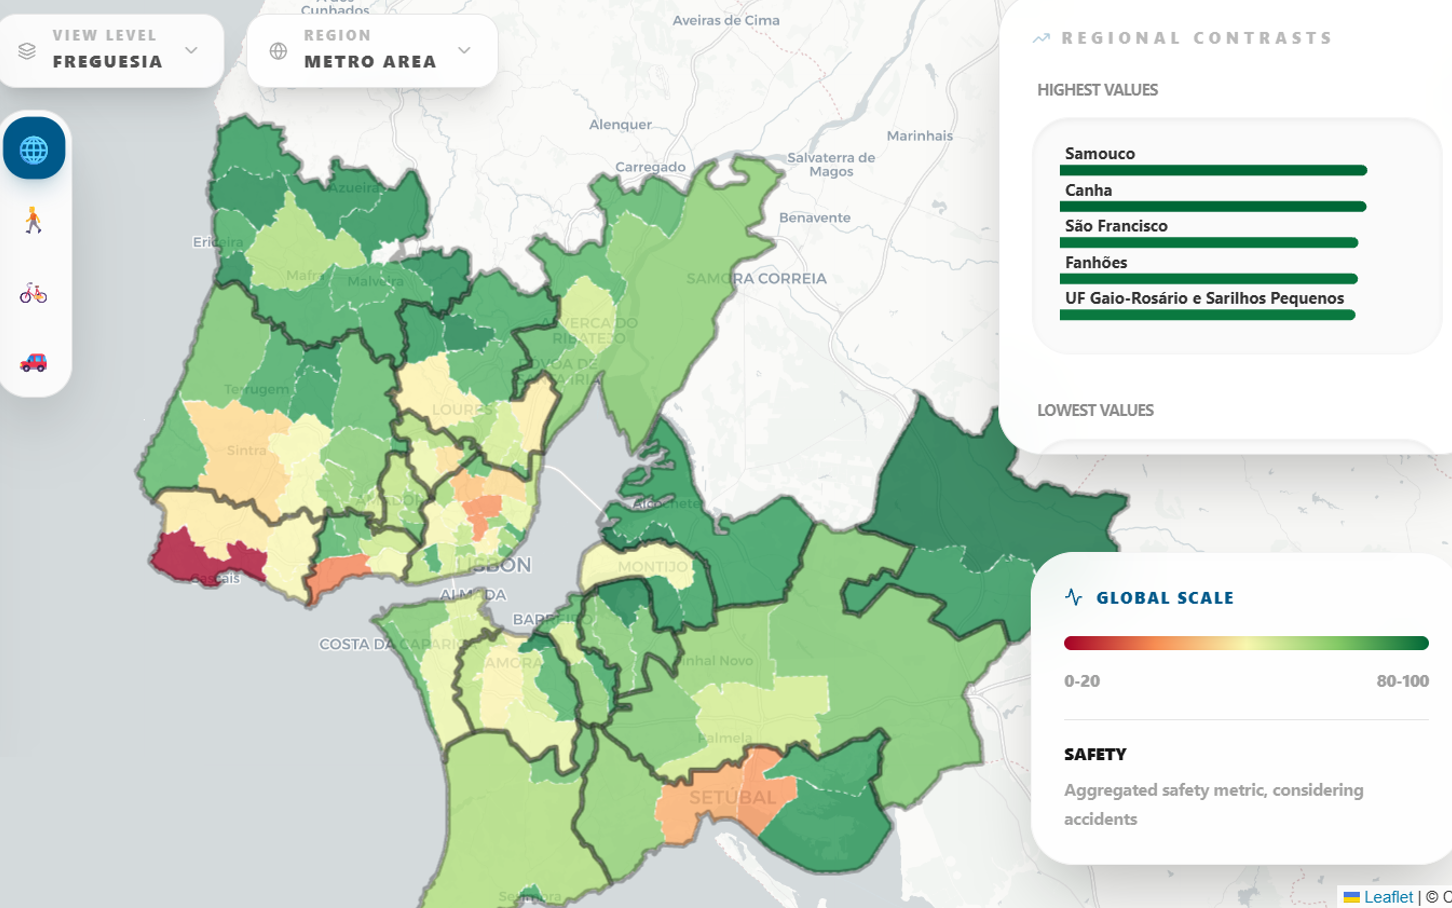
- Urban core scores poorly (high volume of crashes): inverse spatial pattern
- Worst rates in coastal EN6 corridor (Oeiras/Cascais), and Lisbon centre, with very high incomes
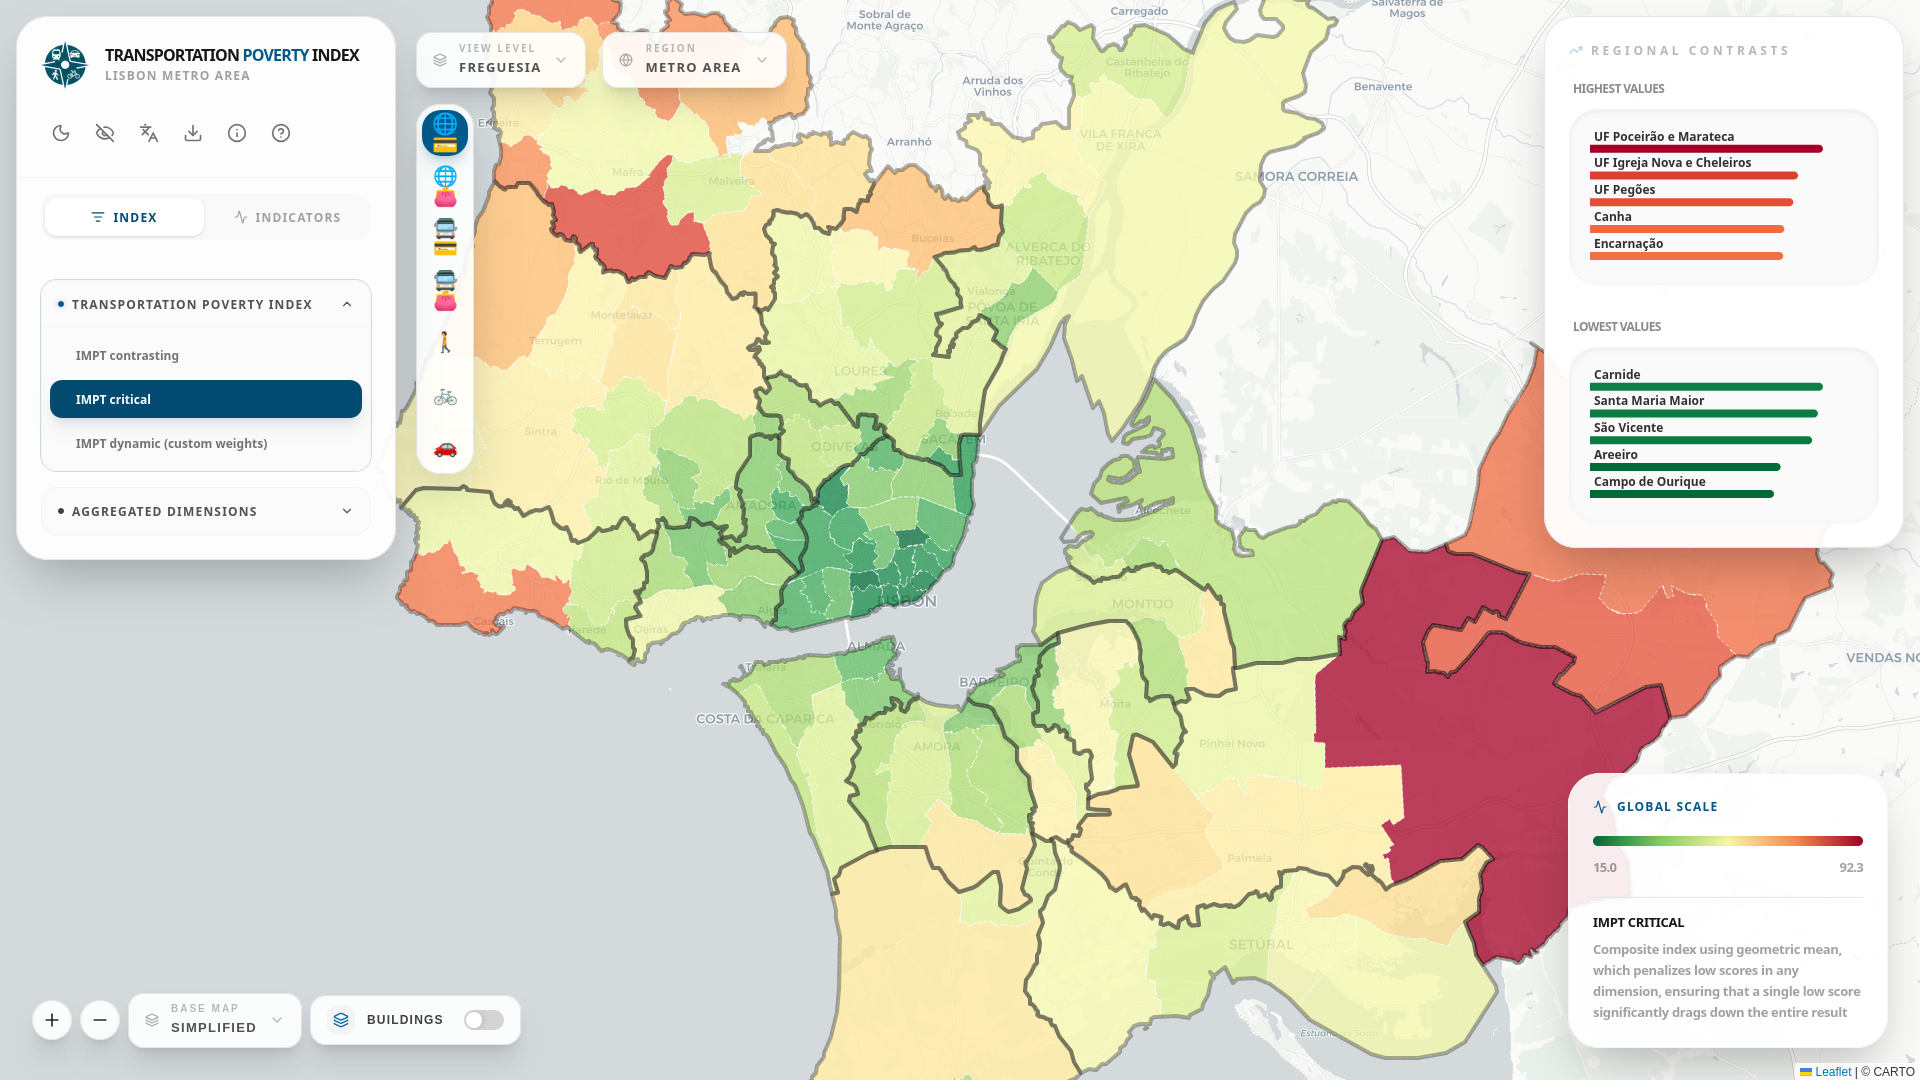
IMPT Index: Three Aggregation Methods
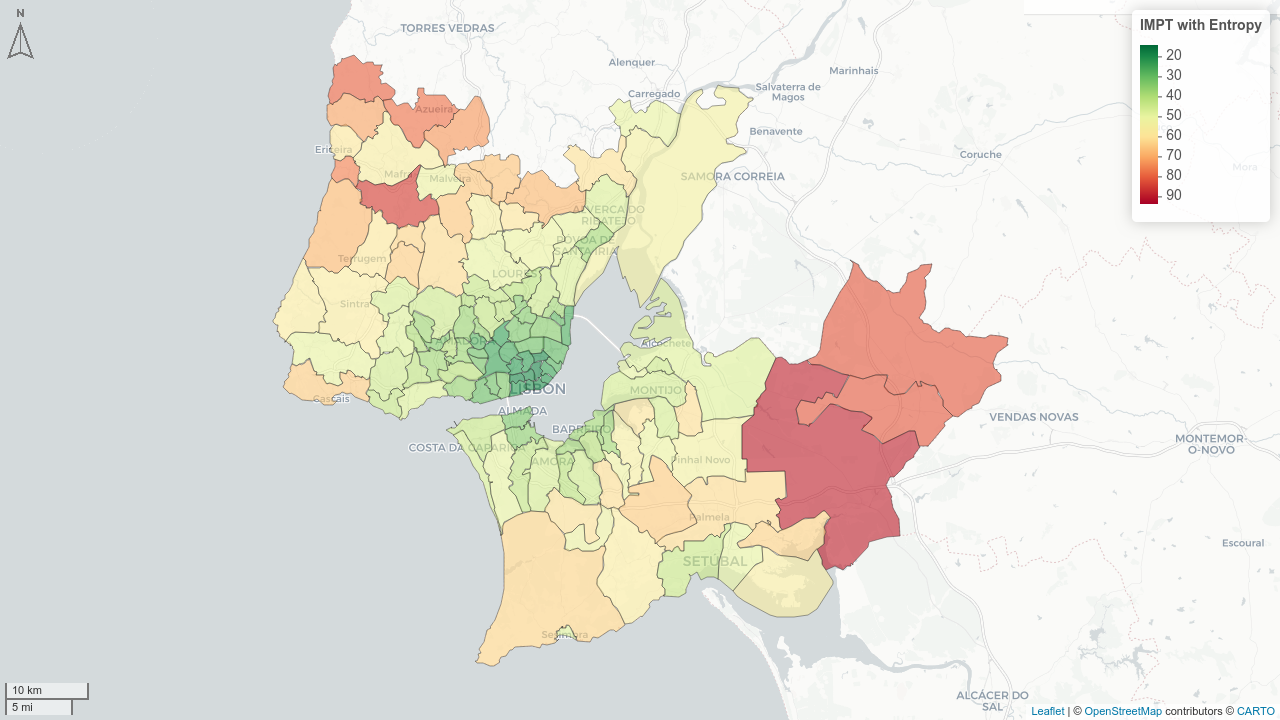
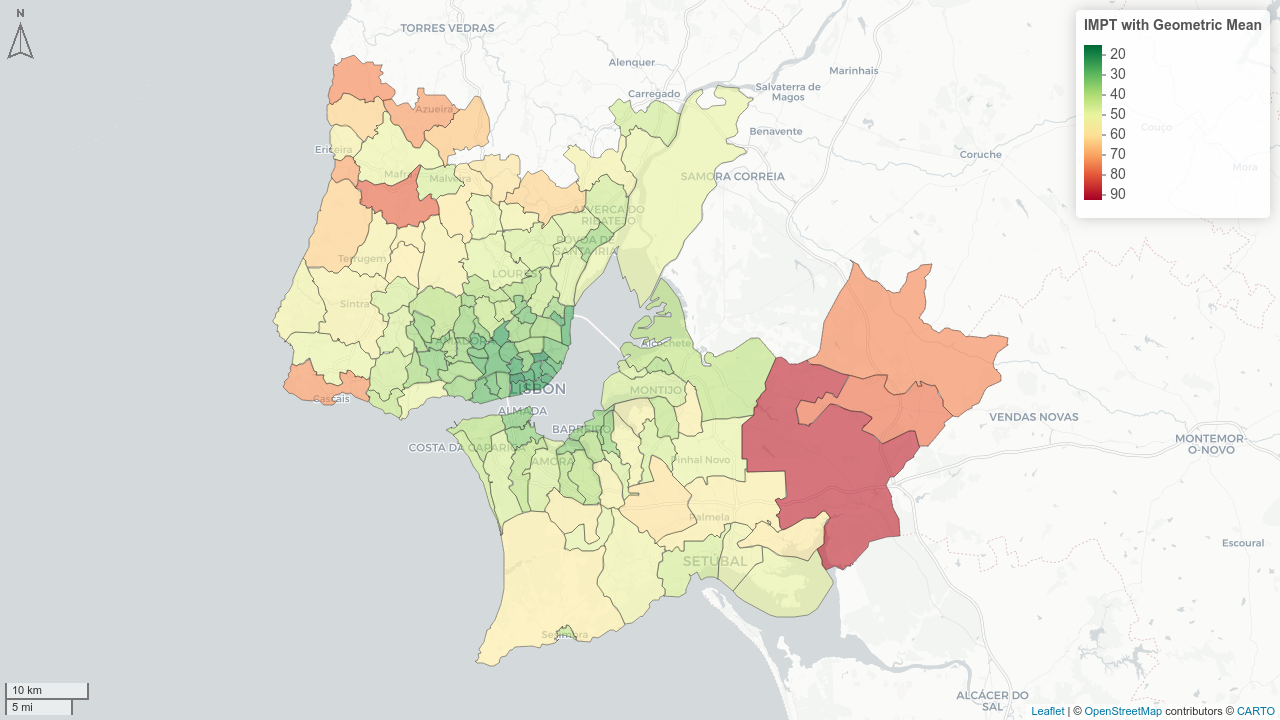
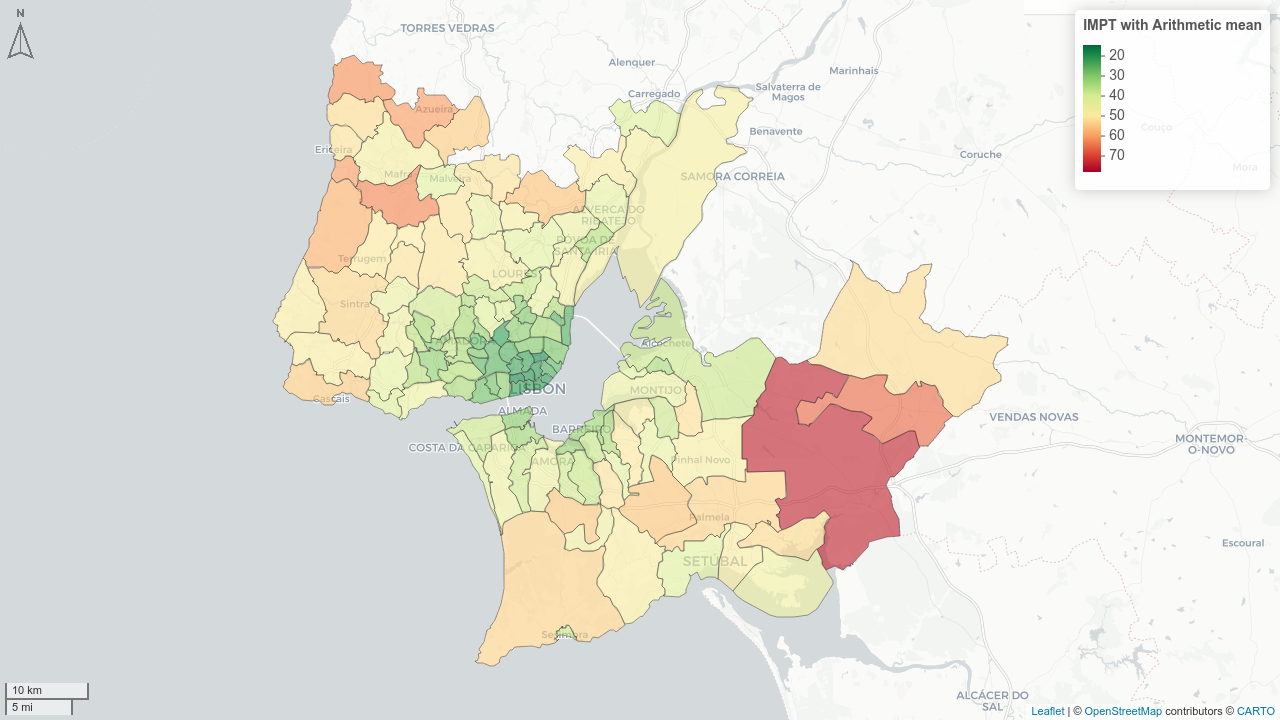
All modes · Parish level · Higher score = higher transport poverty
The Critical IMPT (geometric mean) is best for identifying specific dimensional deficiencies
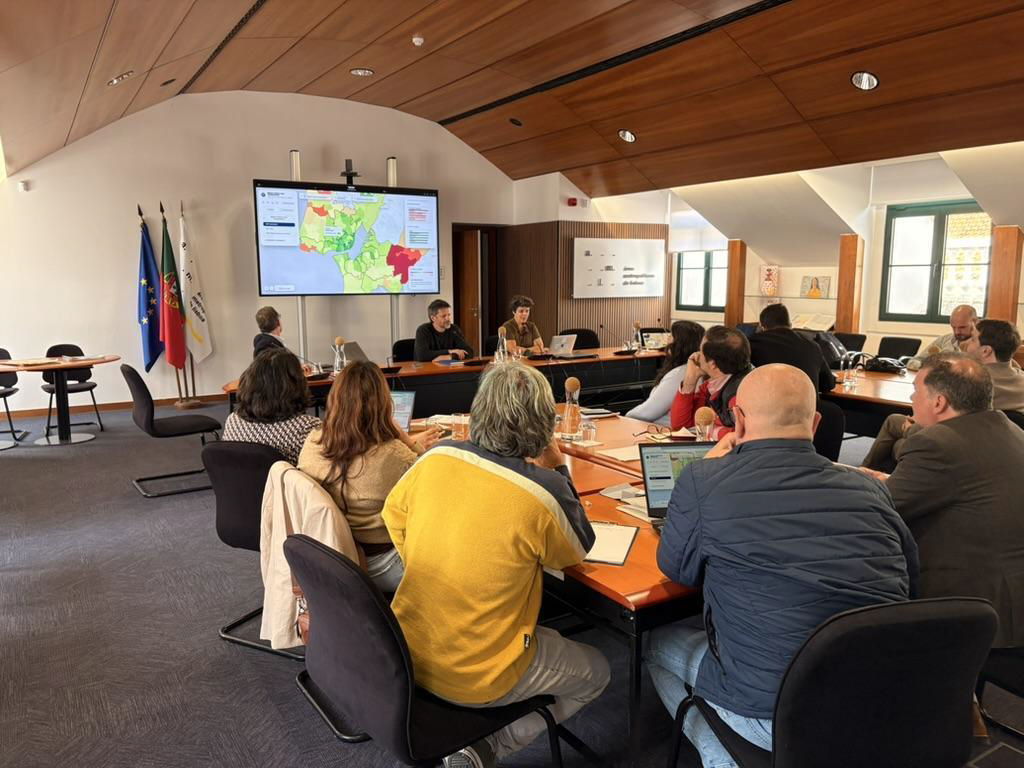
Workshop with Municipalities
- 13/18 municipalities represented + transport authorities + operators
- Participants assessed transport poverty levels in their territories and compared with IMPT scores
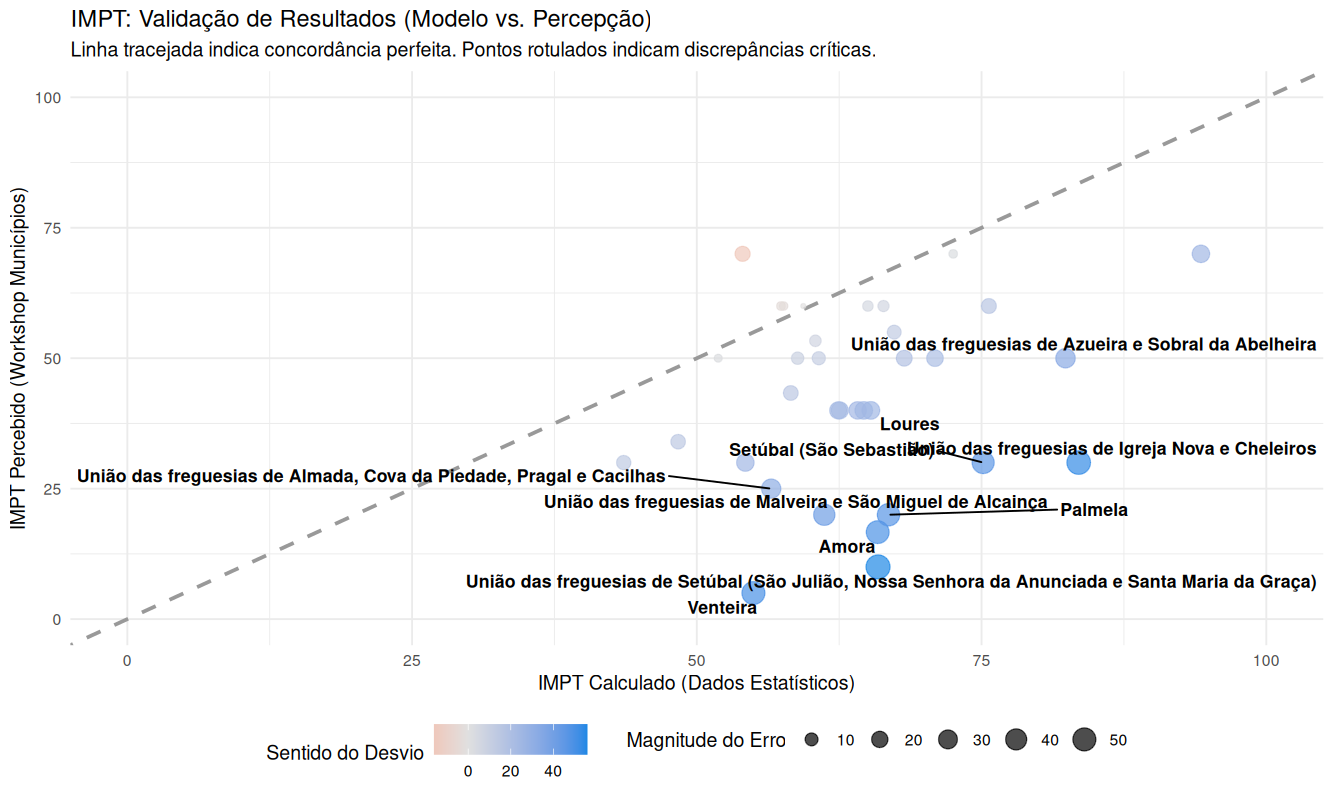
Stakeholders were very optimistic regarding transport poverty in their territories
Main divergence: Safety — participants systematically underestimated crash risks in their territories
Higher convergence than expected for a secondary-data index
Thank you!
Rosa Félix
✉️ rosa.felix@tmlmobilidade.pt // ushift@tecnico.pt
💾 Methodological Report: u-shift.github.io/IMPT-data
🌐 Dashboard and Data: ushift.pt/apps/impt
📄 Paper under review





This research was funded by Science4Policy, a PLANAPP - Centre for Planning and Evaluation of Public Policies iniciative to support the definition and implementation of public policies based on scientific evidence, under the Science4Policy (S4P): Concurso de Estudos de Ciência para as Políticas Públicas call (PLANAPP-S4P/8042/2025).
This research was funded in part by the FCT - Fundação para a Ciência e Tecnologia under Grant UID/6438/2025 of the research unit CERIS.




Your turn!
- Explore the IMPT dashboard
- Start the AHP survey
- Apply your own weights to the indicators!
Where do people actually live?
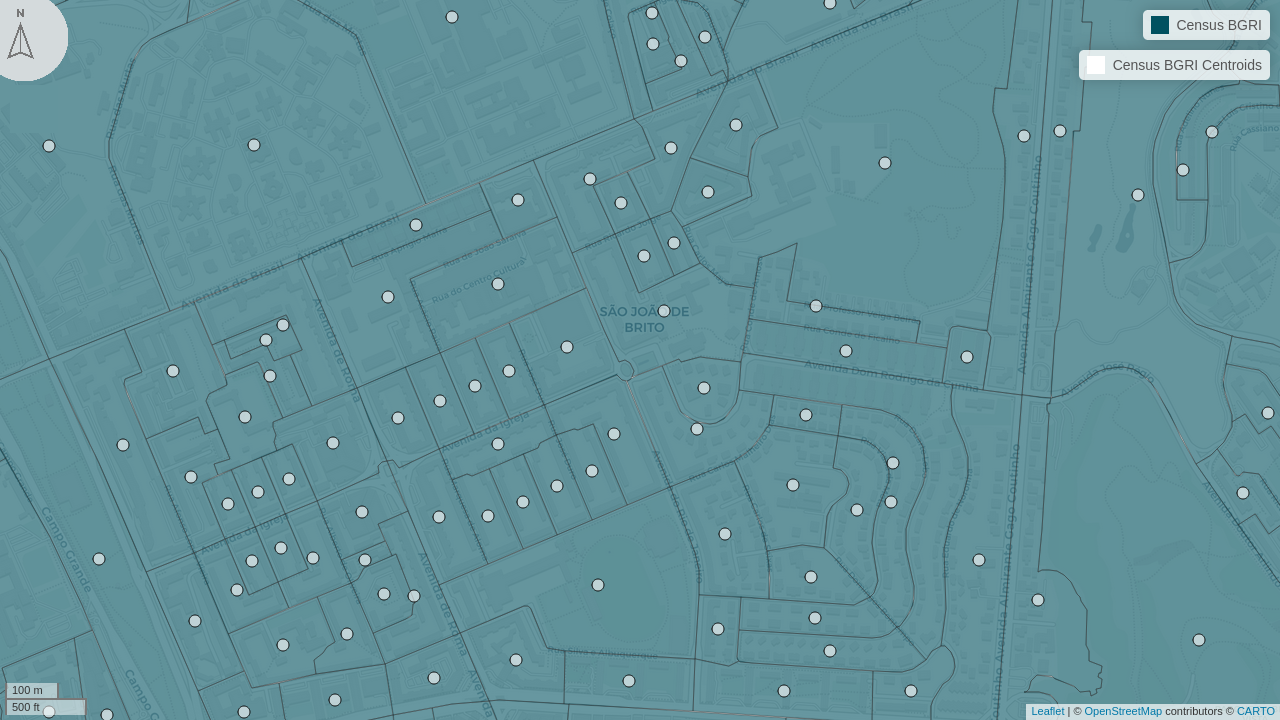
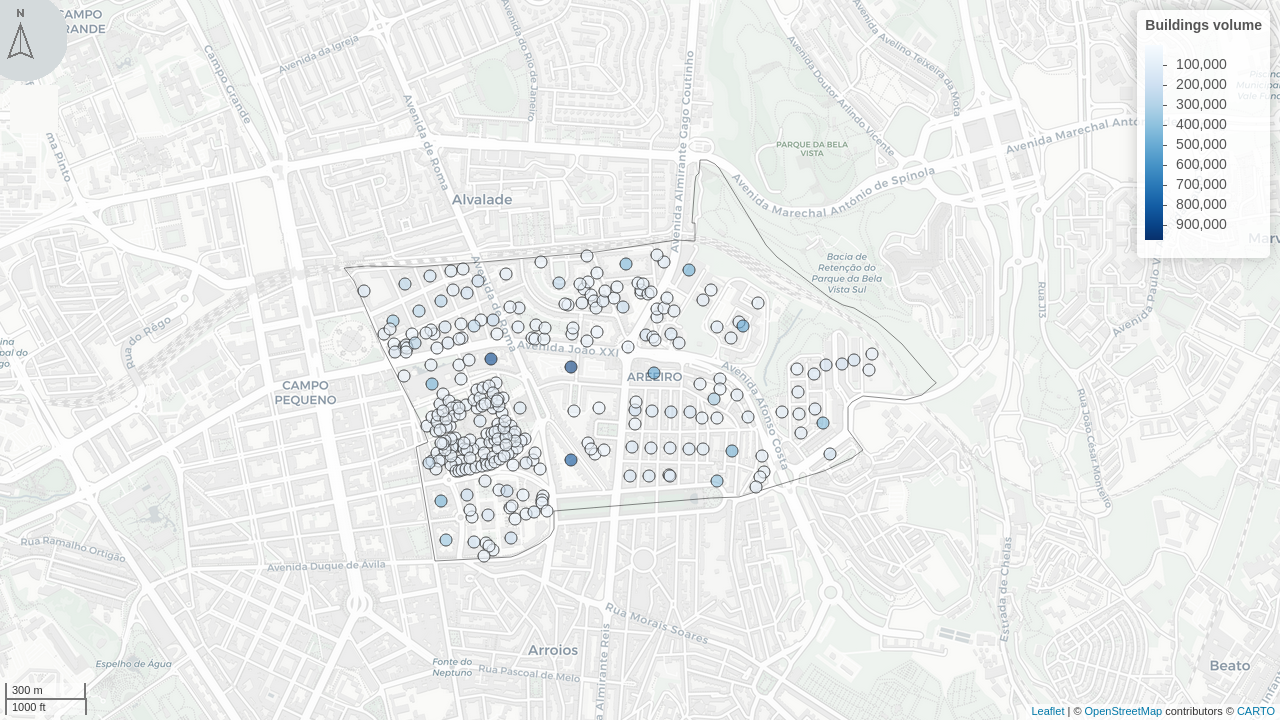
Considering the average over a parish can mislead when people live in a small part of it. Distributing the population across buildings (weighted by its volumes) gives better proxies.