From Isolation to Inclusion

Introducing the Multidimensional Transport Poverty Index tool

Rosa Félix
CERIS, Instituto Superior Técnico
University of Lisbon

Mauricio Orozco-Fontalvo
Gonçalo F. Matos
Miguel Alvelos
Camila Garcia
Filipe Moura

July 2026 — NECTAR 2026, Munich

Why Transport Poverty?

Transport Poverty


Transportation is essential — its absence or inadequacy creates:

  • 🚫 Limited access to work, education, health, leisure, services and opportunities
  • 🏘️ Social exclusion & territorial inequality
  • 💸 Disproportionate financial burden on low-income households
  • ☠️ Unequal exposure to road risk

Transport Poverty (Lucas et al. 2016) has direct consequences in social exclusion and territorial cohesion (Pritchard et al. 2014; Allen and Farber 2019; Mejia-Dorantes and Murauskaite-Bull 2022)


EU Regulation 2023/955 (Social Climate Fund) provides the first legally binding definition of Transport Poverty at European scale (European Parliament and the Council of the European Union 2023)

A Multidimensional Problem

Based on Lucas et al. (2016), Mejia-Dorantes and Murauskaite-Bull (2022) and the European Commission (2024):


🗺️ Accessibility
Ability to reach work, health, education, and other essential services within reasonable time

🚌 Mobility
Quality of transport supply: frequency, coverage, travel times, active travel infrastructure

💶 Affordability
Households’ capacity to afford transport (+ housing) relative to income

🦺 Exposure to Externalities
Exposure to road externalities: safety, crash severity, air pollution, noise

What is Missing?

  • ❌ No composite index integrating all 4 dimensions, across multiple transport modes
  • ❌ Existing indexes rely on costly primary data (surveys)
  • ❌ No operational tool translating research into policy support


👉 We wanted to create an index
Multi-dimentional · Multi-modal · Scalable · Replicable
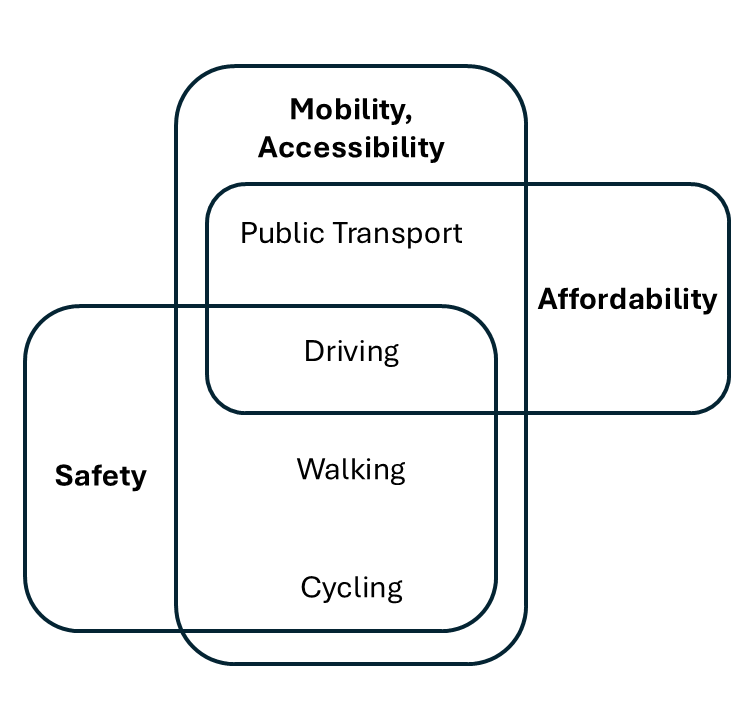
Modes considered per dimension

Methodology

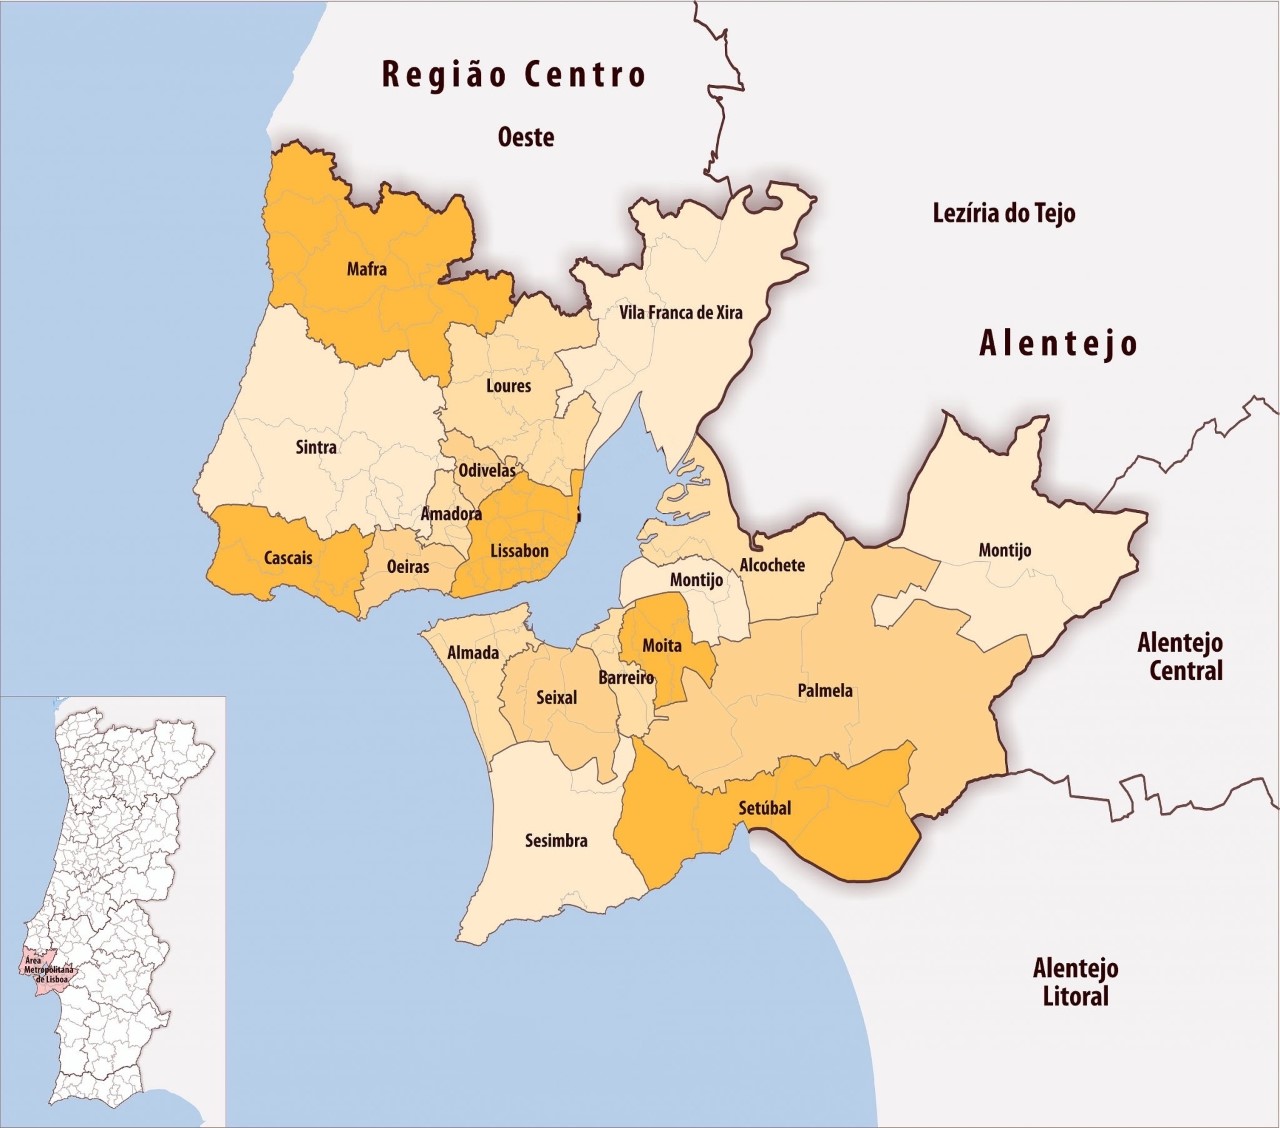
Case Study: Lisbon Metropolitan Area

  • Polycentric structure (strong employment / opportunities core in Lisbon)
  • Strong urban/peripheral PT supply contrast
  • High car modal share in periphery

Source: Wikipedia
  • 18 municipalities · 124 parishes · ~2.8M inhabitants, 3,000 km²
  • Analysis unit: freguesia (parish) — lowest admin level with full data coverage
  • Also computed at municipality and H3 grid level, resolution 8 (~3,686 hexagons)

Open Data

Source Used for
INE Census 2021 / IMOB 2017 Income, housing, commuting OD pairs, modal share
OpenStreetMap Road network, cycling/pedestrian infra, POIs
GTFS (9 operators) PT frequency, travel times, coverage
ANSR (road safety) Accident locations and severity (2019-2023)
Carris Metropolitana Health centres, schools
PMMUS / TML Shared mobility docks
GlobalBuildingAtlas Buildings height (population density)


All computations done in R using odjitter, r5r, accessibility, sf, tidytransit, FactoMineR (Carlino and Lovelace 2022; Pereira et al. 2021; Pereira and Herszenhut 2022)

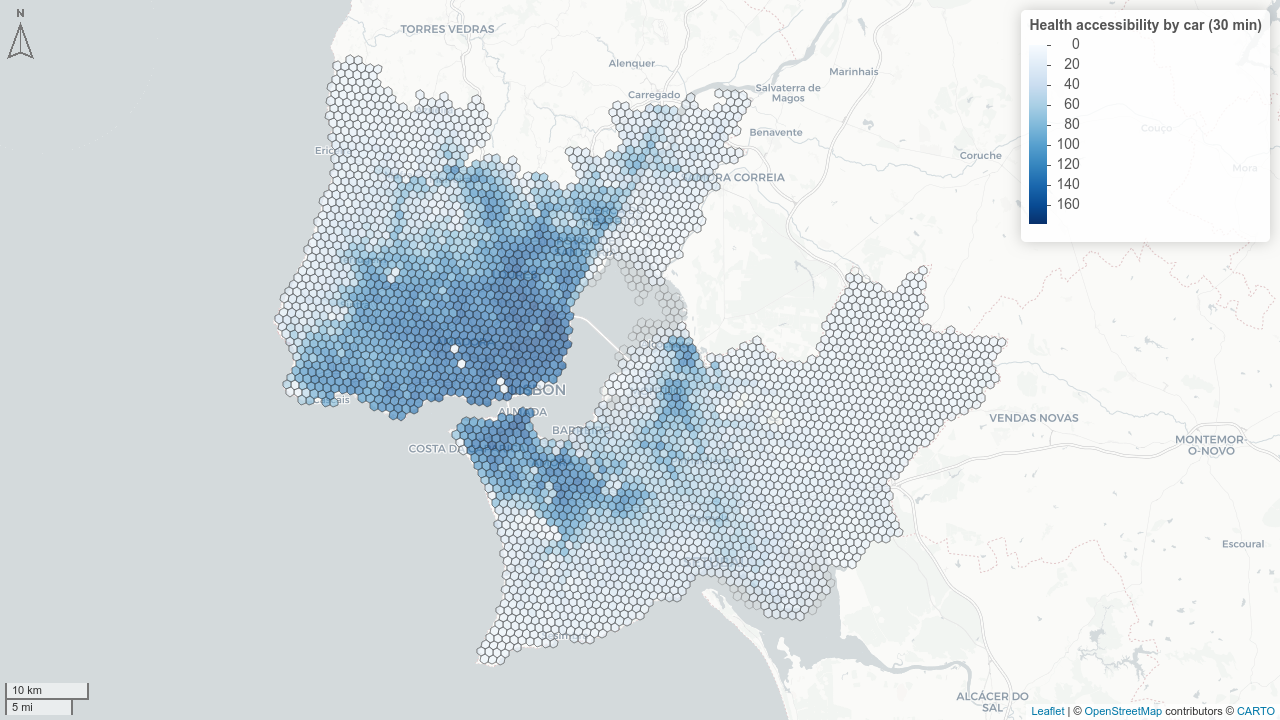
Computing Accessibility

  • Travel time matrix for all modes × all H3 res 8 grid cells
  • 📍 Points of interest: healthcare, schools, groceries, green spaces, recreation, jobs
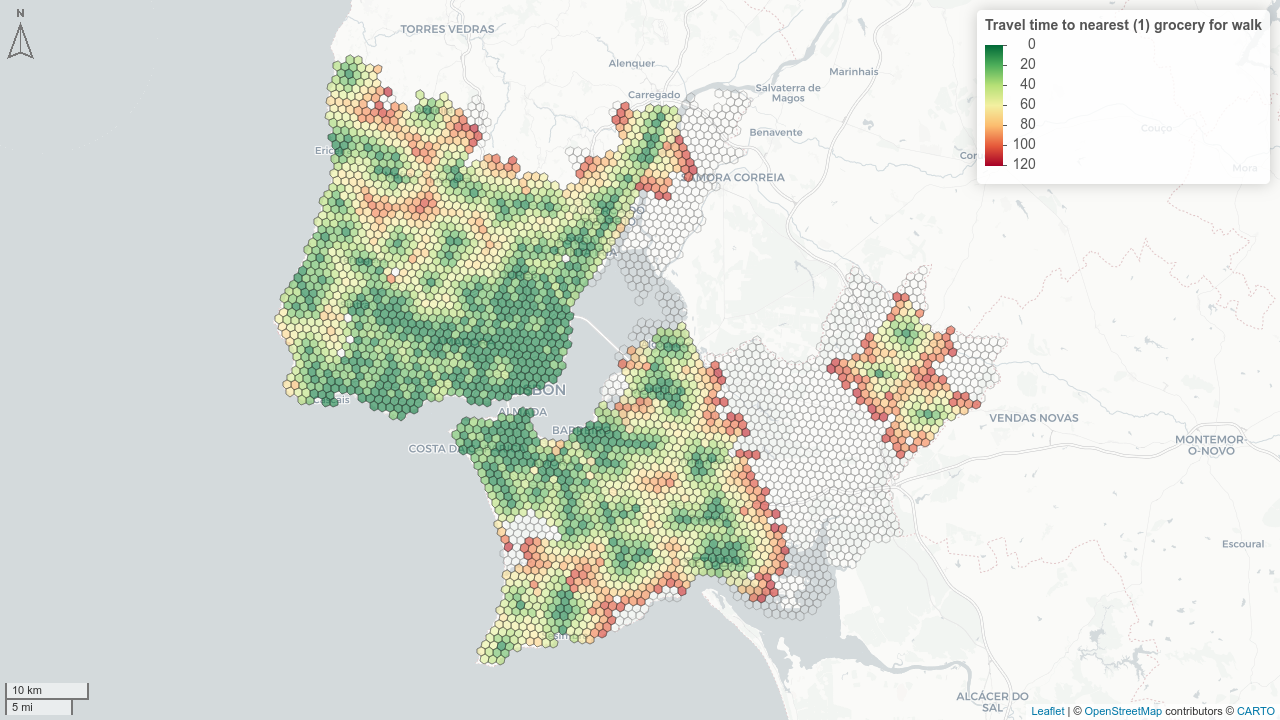
Walking time to the closest groceries

Commulative accessibility by car to health centres

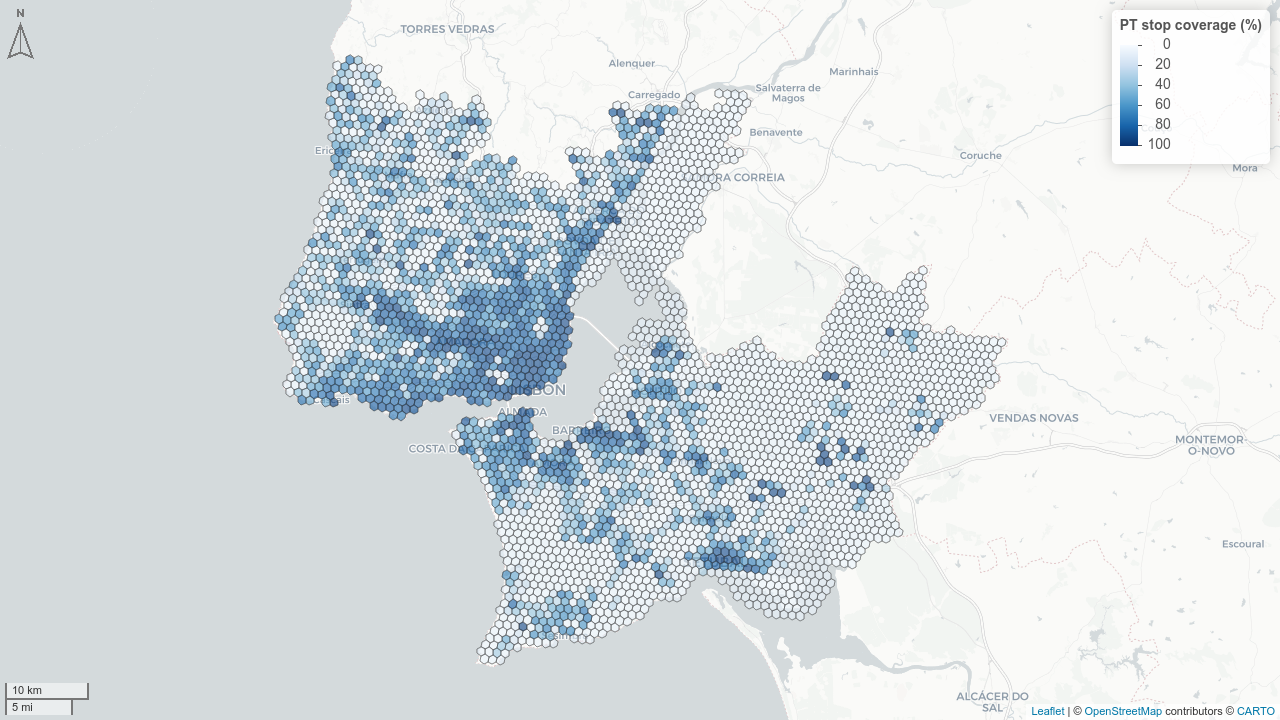
Computing Mobility

Systemic quality of the transport system:

  • ⌛💼 Average commuting time (by mode)
  • 🔁 Average transfers (public transport)
  • 🕑 PT headways (peak / off-peak / night / weekend)
  • 🚏 PT population coverage (walking isochrones to stops)
  • 🚴 Cycling and pedestrian infrastructure ratio (from OSM)
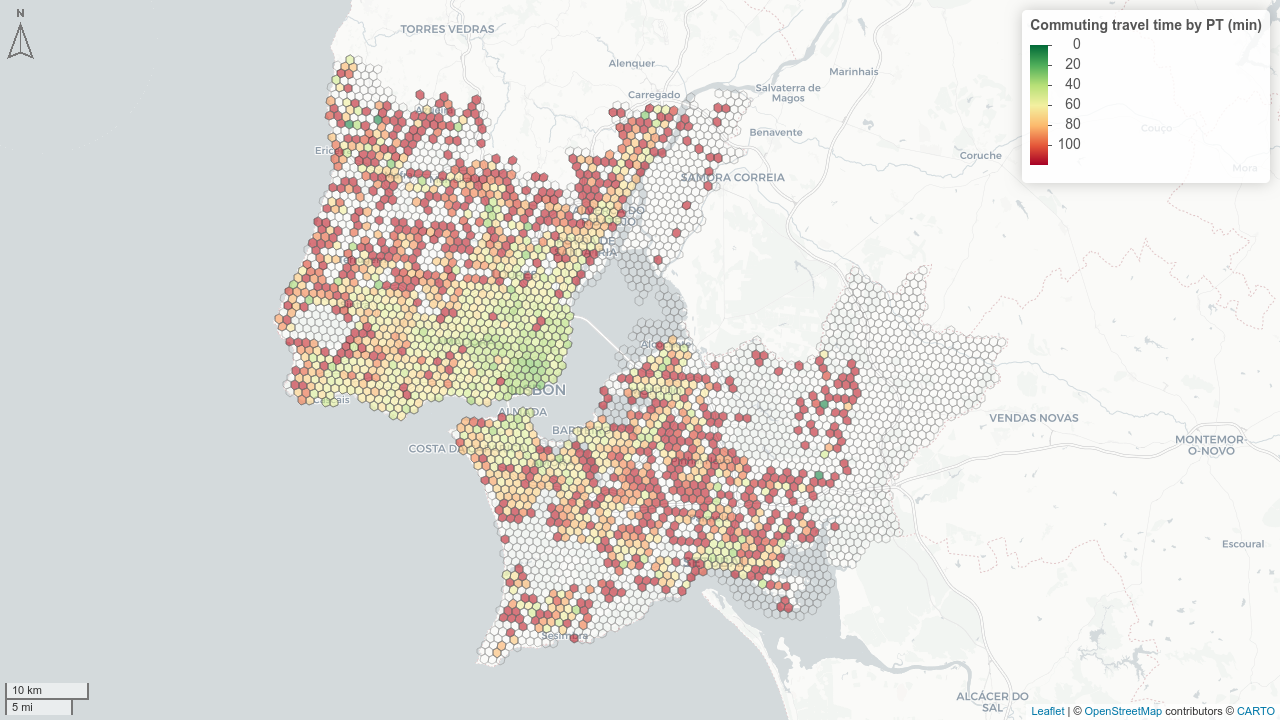
Commuting time with PT

Population covered by walking-distance PT stops

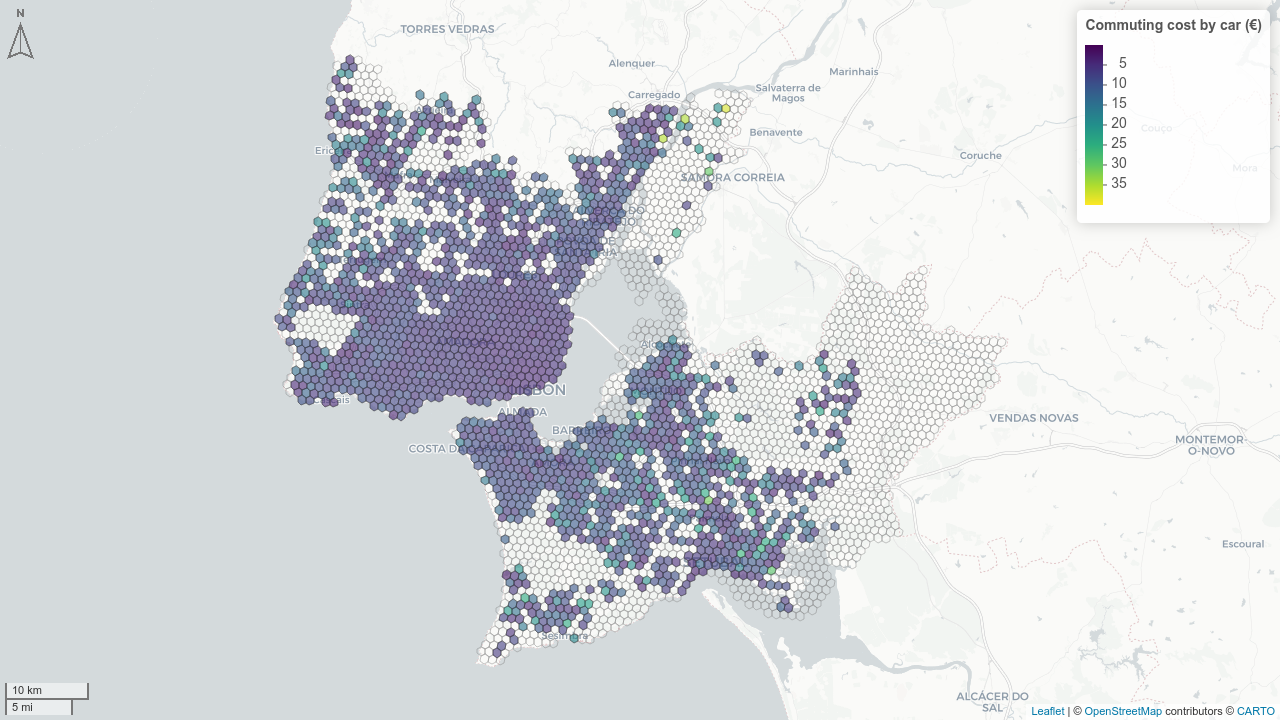
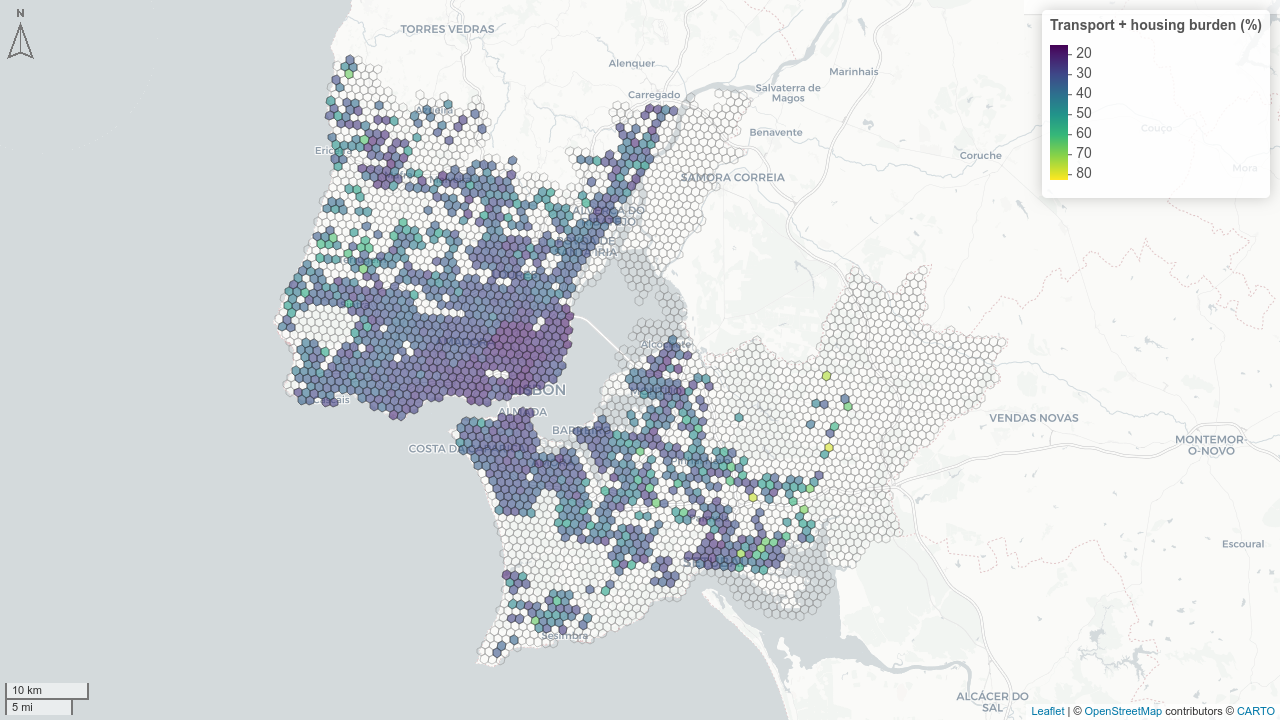
Computing Affordability

“Housing + transport costs ≤ 45% of income” threshold (Isalou et al. 2014; Litman 2026)

\[transp\_inc\_comp = \frac{HH_{size} \cdot P_{mobile}}{I_{household}} \cdot \left[\frac{C_{car,day}}{O} \cdot \frac{s_{car}}{\Sigma s} + C_{PT,day} \cdot \frac{s_{PT}}{\Sigma s}\right] \cdot N_{working\_days}\]

  • Car cost: €0.40/km + tolls (via Infraestruturas de Portugal routing)
  • PT cost: single ticket (~€1.91) or monthly pass Navegante (~€25.25/month)
Transport + Housing burden (%)

Commuting costs by car (€)

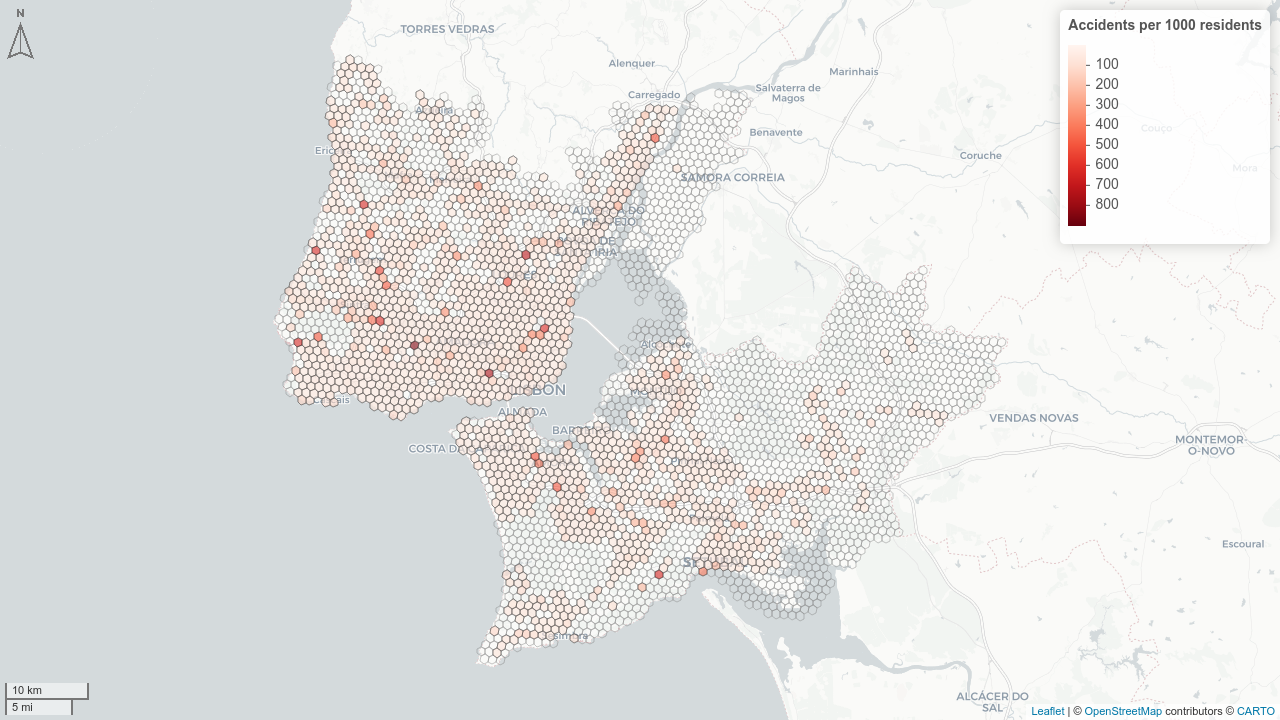
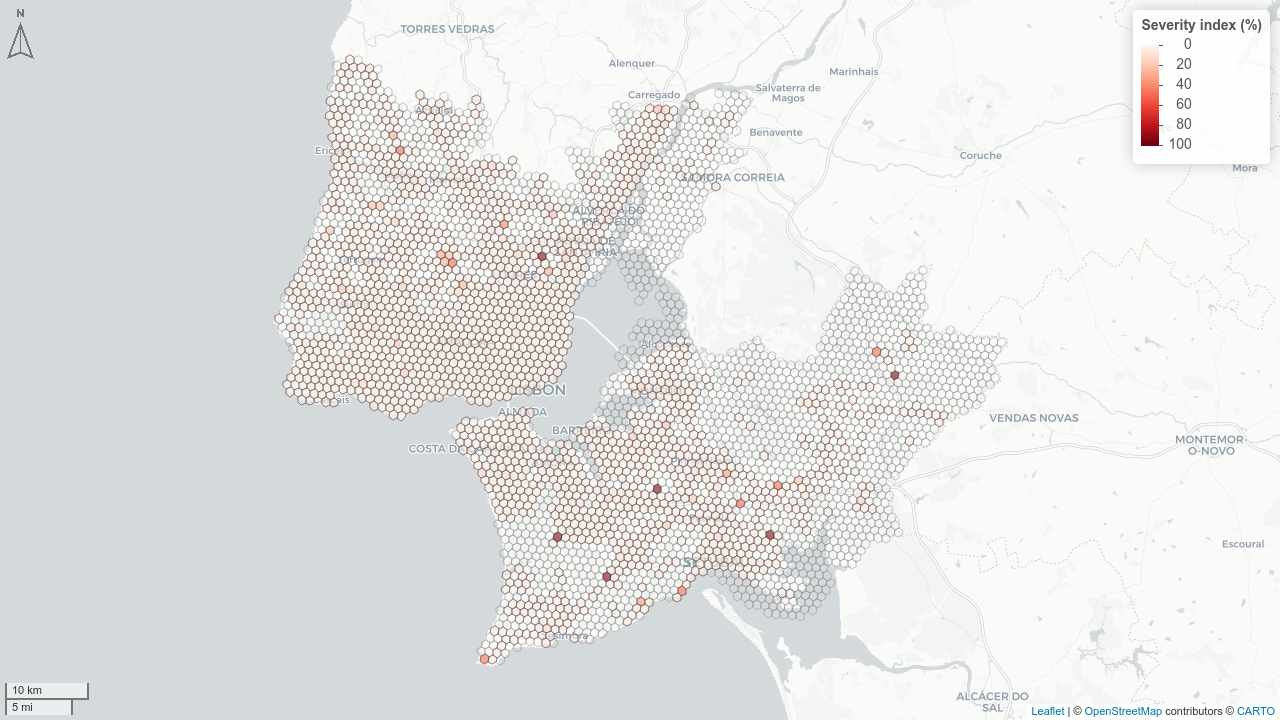
Computing Safety

Based on ANSR road accident data (2019–2023), within-locality crashes only:

Indicator Formula
Accident rate \(\sum Acc_{5y} / Pop \times 1000\)
Fatality rate \(\sum MV_{30d} / Pop \times 1000\)
Severity index \(\sum MV_{30d} / \sum Victims_{5y}\)
Mode-specific severity fatalities / vehicles of that mode involved


Total accidents per 1000 inhabitants

Severity index (total)

Normalization & Aggregation

All indicators (>1700) normalized to [0, 100] using min-max scaling, depending if is a cost or a benefit:

\[X_{norm} = \frac{X - X_{min}}{X_{max} - X_{min}} \times 100\ \text{ or }\ X_{norm} = \frac{X_{max} - X}{X_{max} - X_{min}} \times 100\]

Intra-dimension: PCA (PC1 score) aggregates multiple indicators (OECD et al. 2008)


Inter-dimensional aggregation

Variant Method Best for
🔵 Contrasting Entropy-weighted mean Territorial contrast
🔴 Critical Geometric mean Worst-dimension penalization
🟡 Balanced Arithmetic mean Compensatory / communication
⚙️ Custom Analytic Hierarchy Process (AHP) weighting Decision-maker preferences

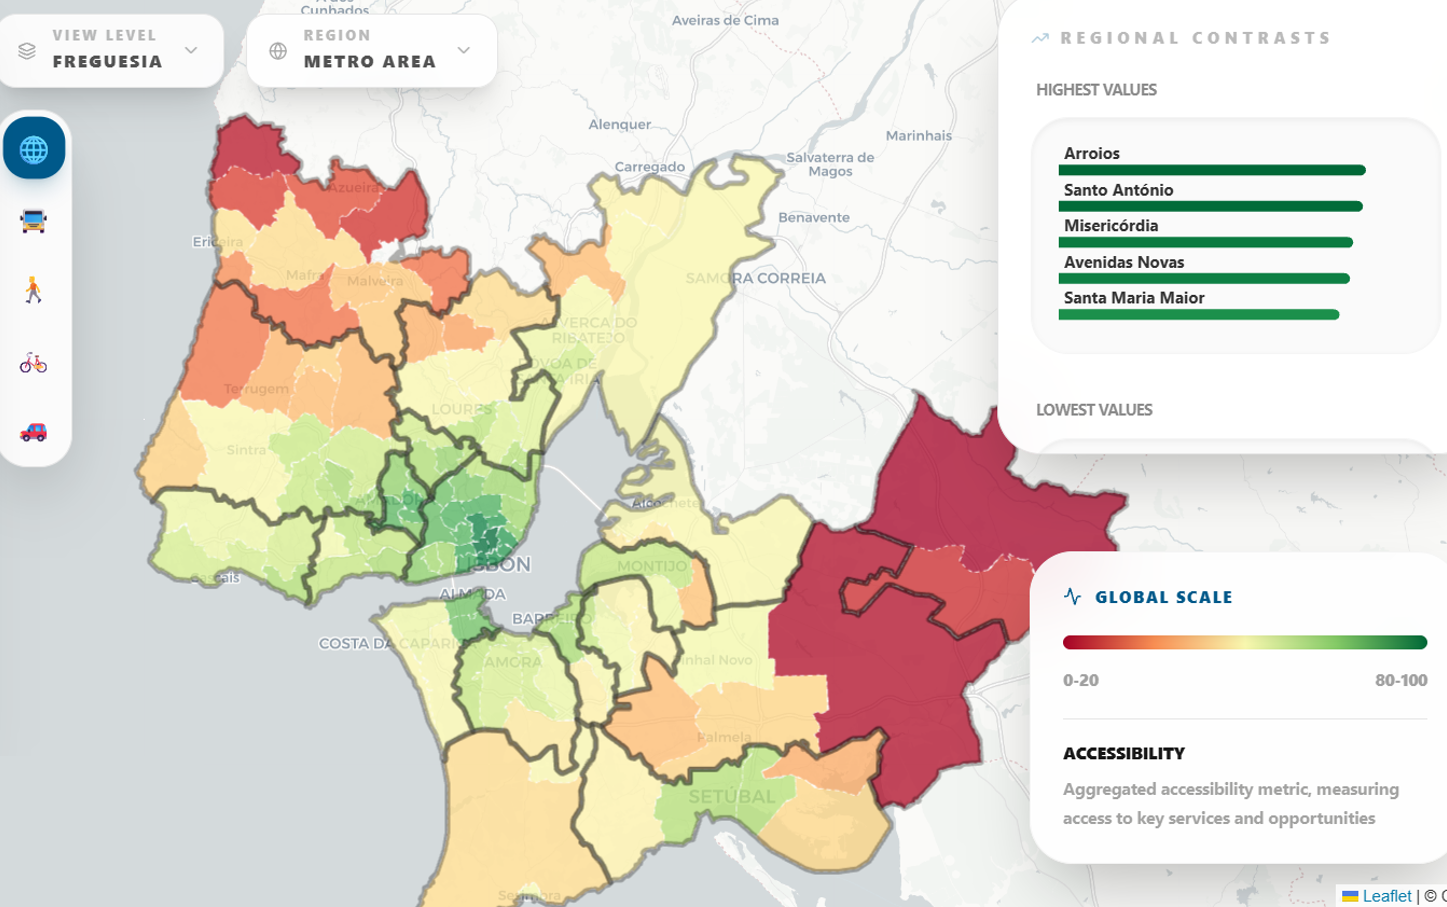
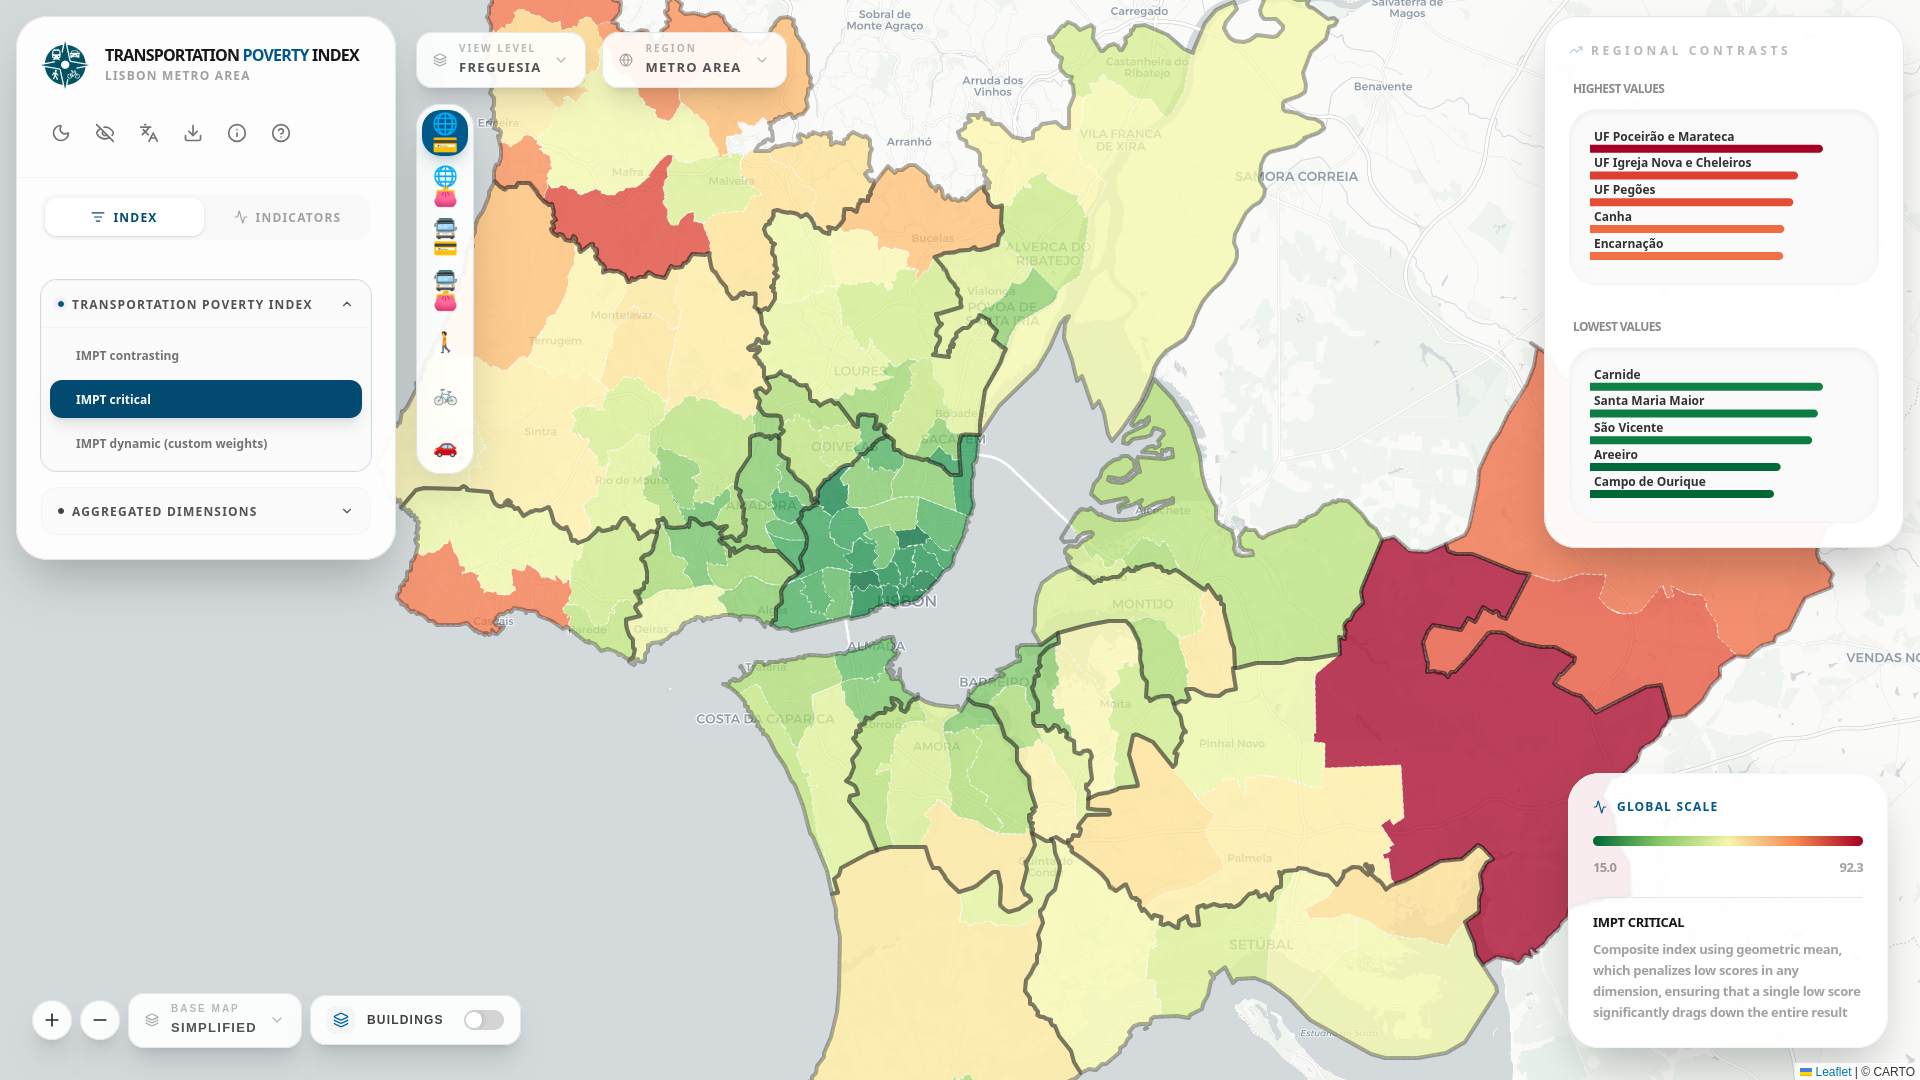
The IMPT Dashboard

Dashboard: 🎮 Live Demo

Available at:
🔗 ushift.pt/apps/impt


Features:

  • 🗺️ Interactive maps at parish, municipality & grid scales
  • 📊 All dimensions × transport modes × indicators
  • ⚙️ Political IMPT: user-defined AHP weights
  • 📥 Downloadable results (>1700 indicators)
Results

🗺️ Accessibility


  • High accessibility in the center
  • Deficiencies concentrated in rural/low-density areas

🚌 Mobility
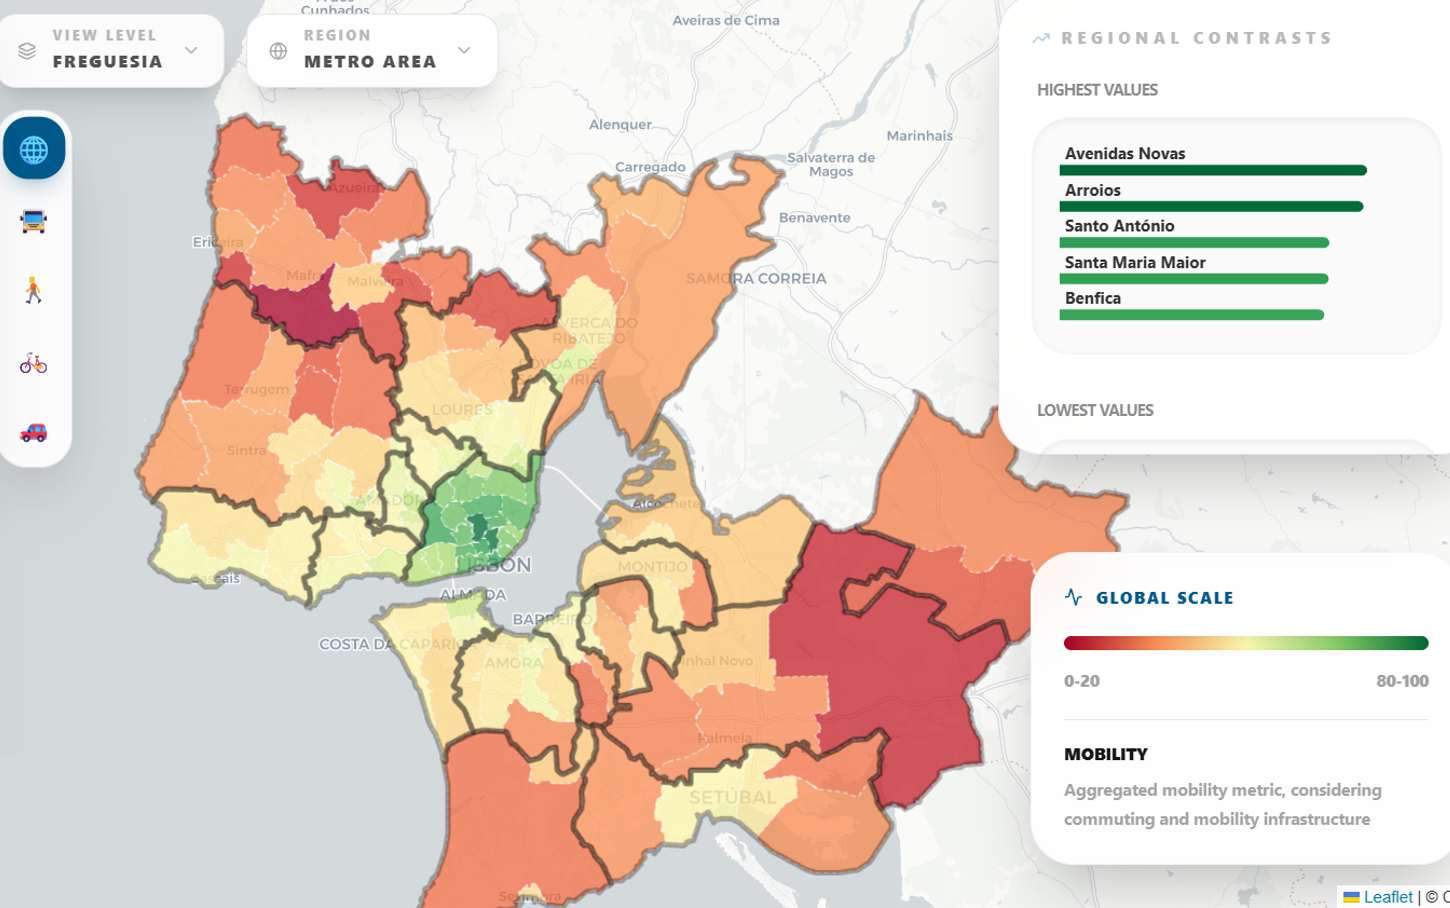

  • Low scores in most AML except the center
  • Periphery is severely underserved
  • Highlights the radial structure of the LMA

Mobility justice?

💶 Affordability
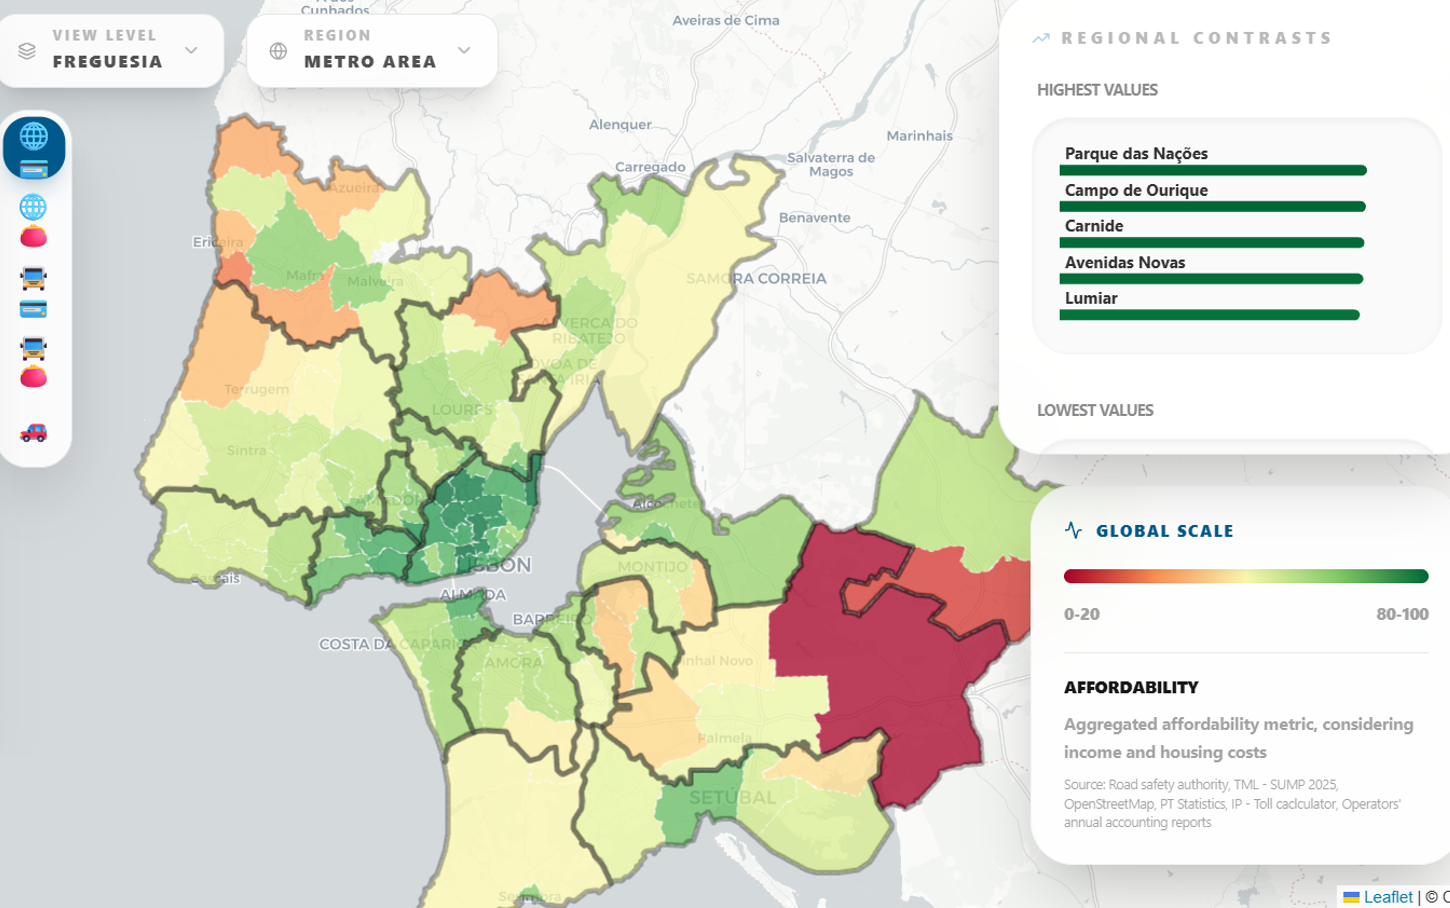

  • High scores overall
  • The Navegante monthly pass greatly mitigates costs (inexpensive)
  • Worst cases in low-income, car-dependent areas
  • Housing more expensive where Transportation is more affordable and vice-versa

🦺 Safety
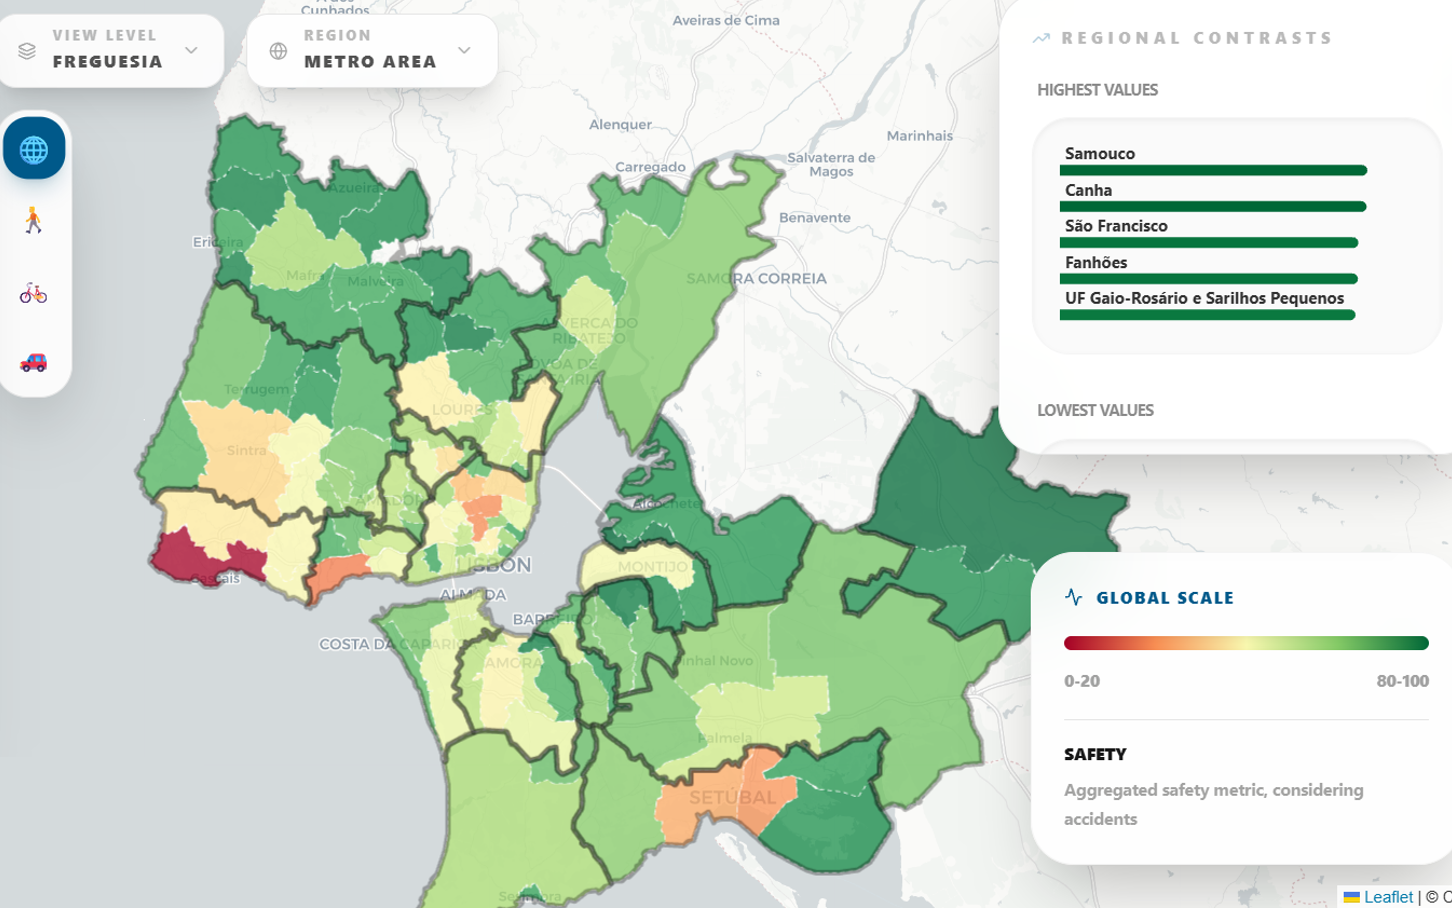


  • Urban core scores poorly (high volume of crashes): inverse spatial pattern
  • Worst rates in coastal EN6 corridor (Oeiras/Cascais), and Lisbon centre, with very high incomes

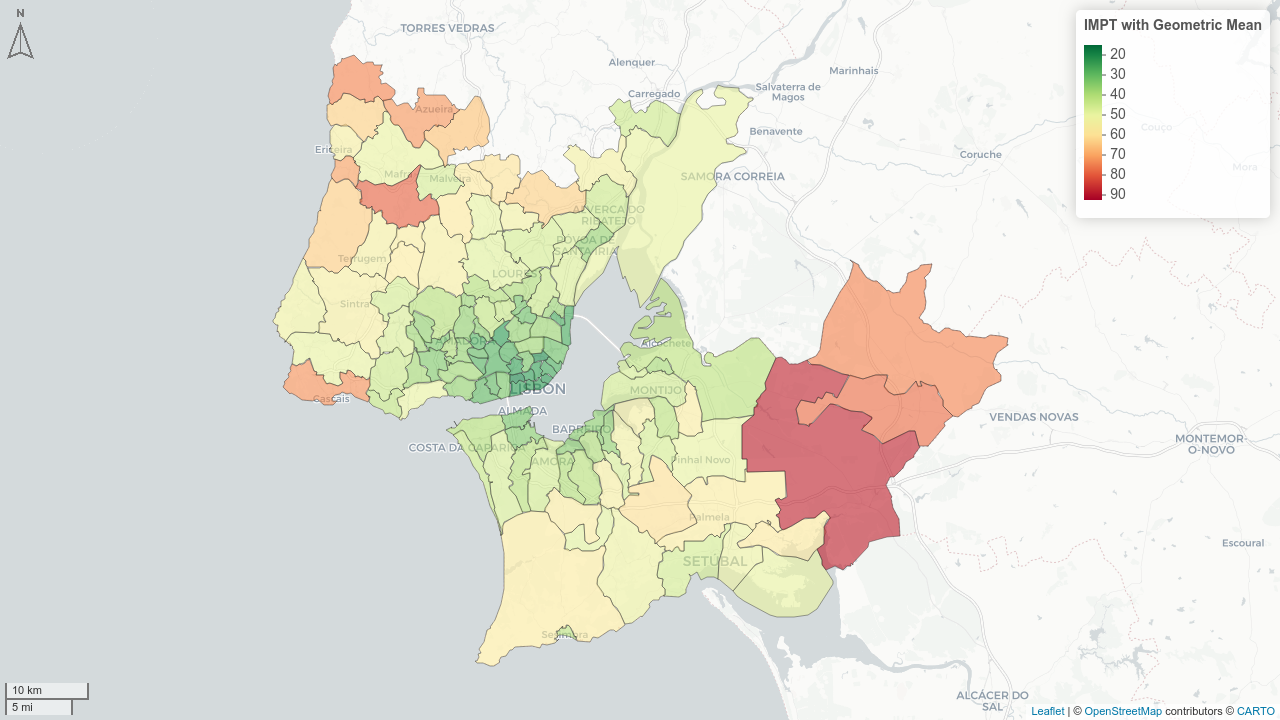
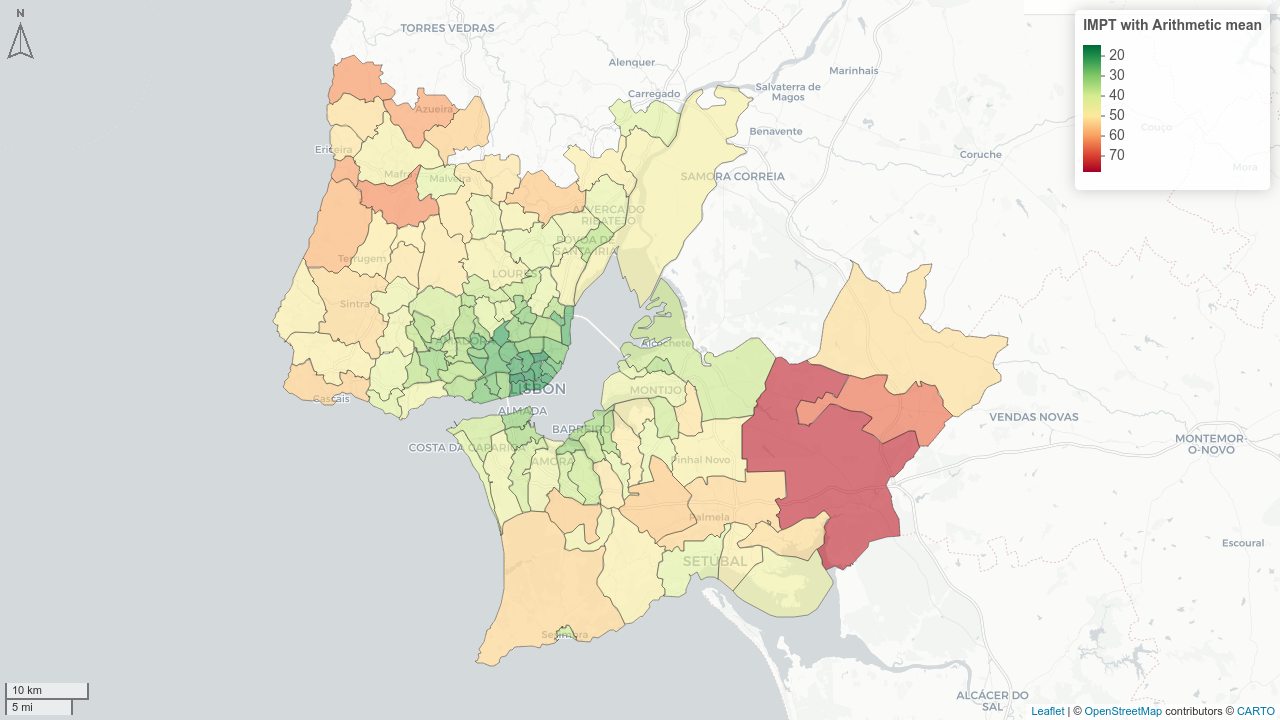
IMPT Index: Three Aggregation Methods
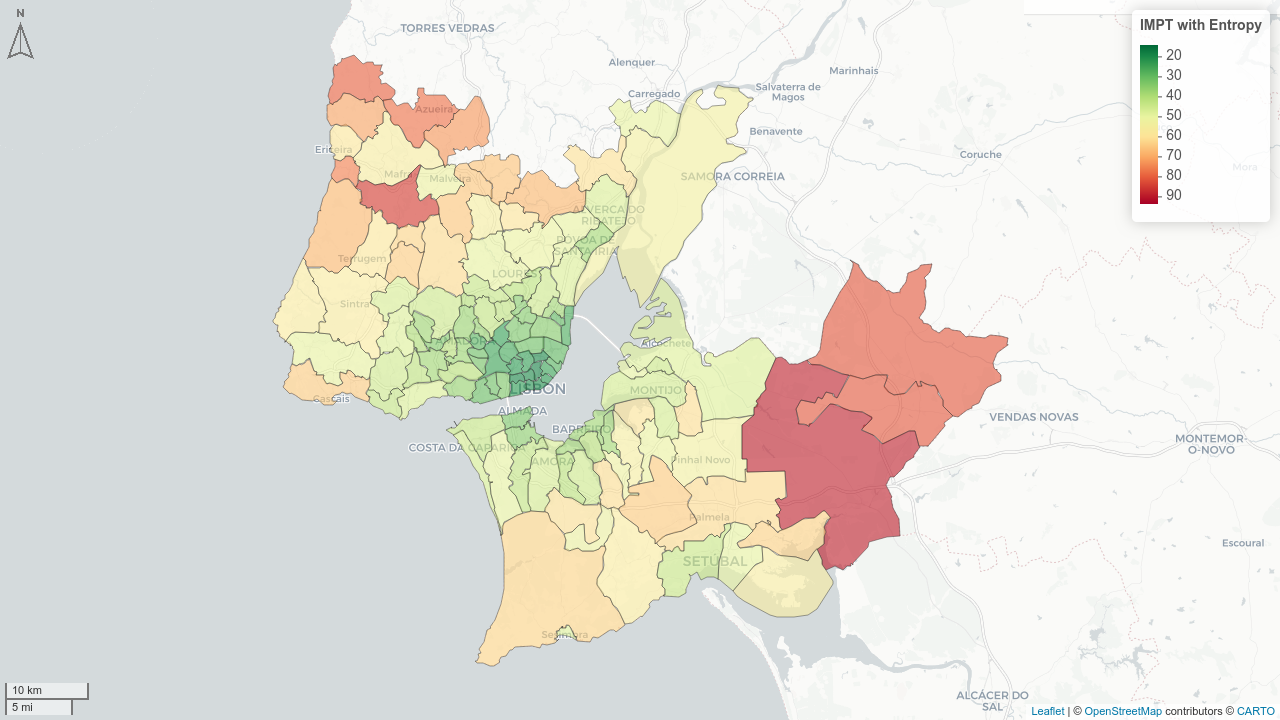
Contrasting IMPT

Critical IMPT

Custom Weights IMPT

All modes · Parish level · Higher score = higher transport poverty


The Critical IMPT (geometric mean) is best for identifying specific dimensional deficiencies

Validation

Workshop with Municipalities

  • 13/18 municipalities represented + transport authorities + operators
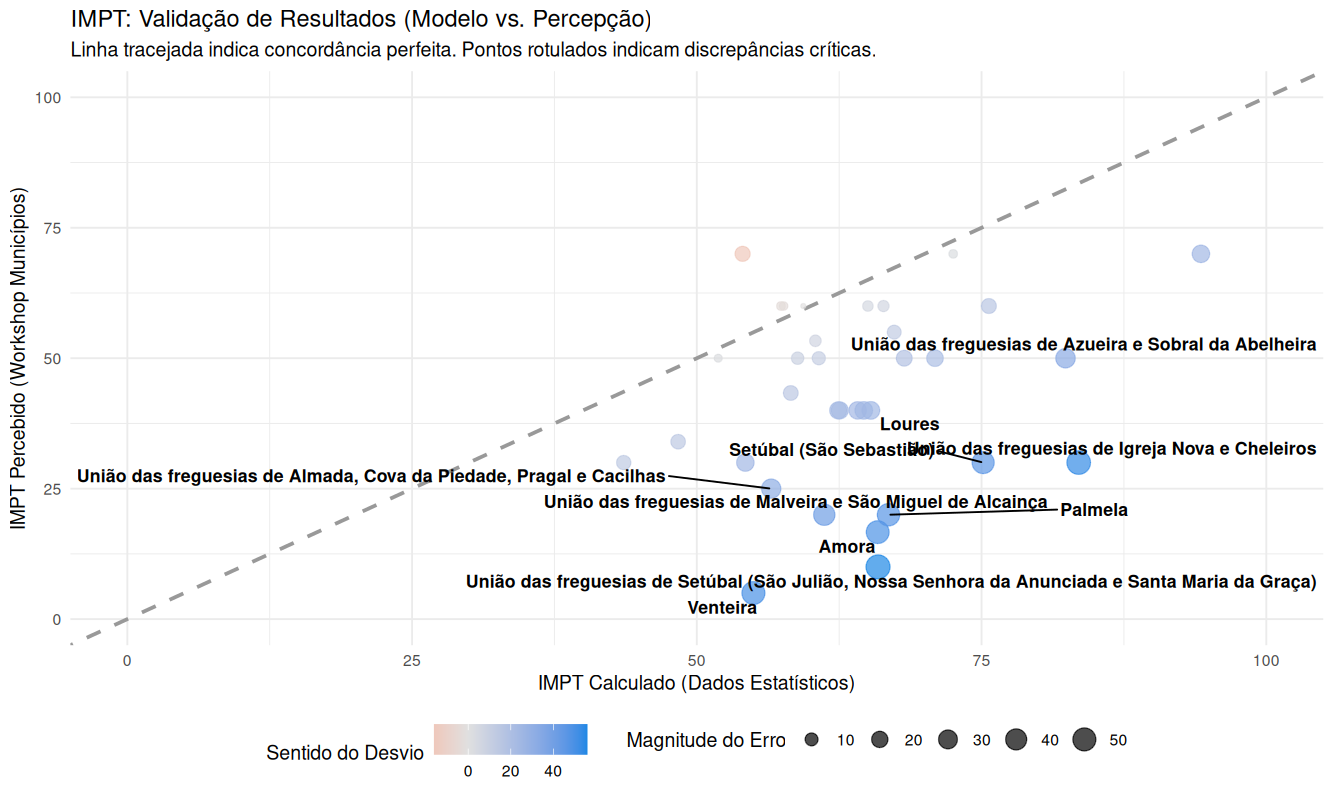
  • Participants assessed transport poverty levels in their territories and compared with IMPT scores

Result: Higher convergence than expected for a secondary-data index

Stakeholders were very optimistic regarding transport poverty in their territories

Main divergence: Safety — participants systematically underestimated crash risks in their territories
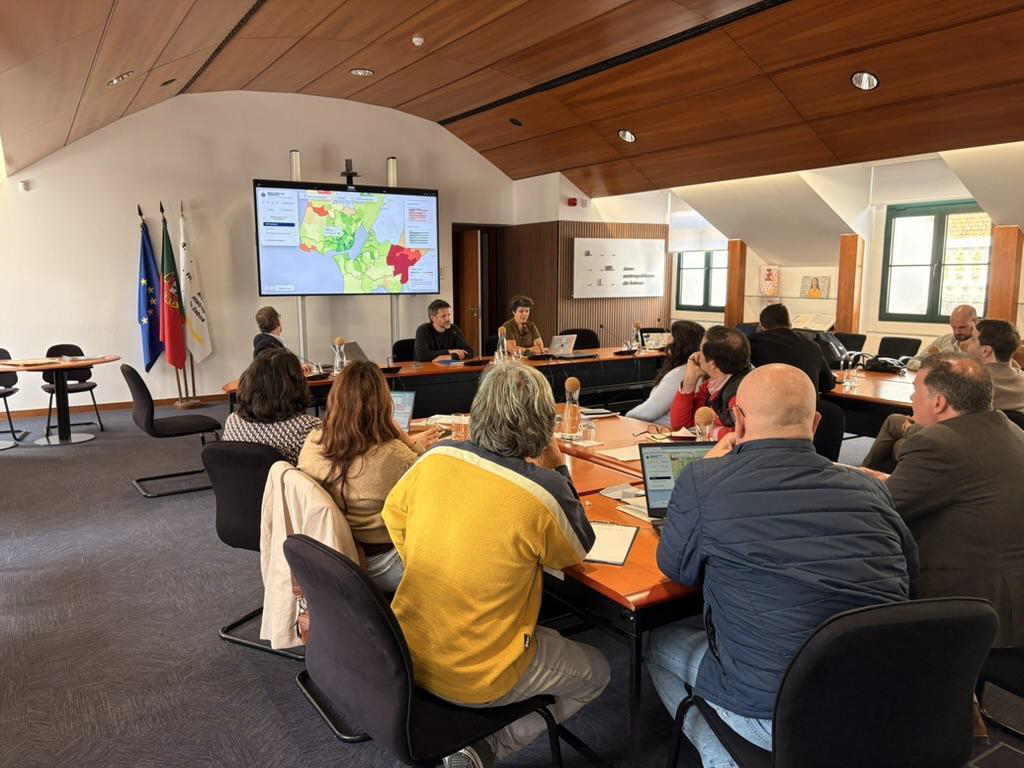
April 9, 2026 at TML

Estimated vs. Percieved

Conclusions

The IMPT allows

  • To diagnose the territory and quantify transport poverty
  • To support decision-makers in prioritizing interventions and investments
  • To compute transport poverty disregarding the indicators available
  • To compute transport poverty at different scales (region, city, parish, grid)

Contributions

  • First multi-dimensional, multi-modal composite index of Transport Poverty for Portugal
  • 4 dimensions (Accessibility, Mobility, Affordability, Safety) × 4 transport modes × 3 aggregation methods
  • Entirely based on open, replicable data
  • Policy-ready: AHP weighting + interactive dashboard
  • Validated with stakeholders
  • Replicable to other metropolitan areas

Limitations

  • Affordability: too few indicators for PCA
  • Digital literacy dimension dropped (data gaps)
  • Environmental externalities not included (air pollution)

Future Work

  • 🌍 Transferability: application to other metropolitan areas
  • 🧠 Include perceived transport poverty as a dimension
  • 💨 Include air pollution and noise exposure as environmental externalities
  • 📡 Longitudinal monitoring: IMPT updates as data becomes available (eg.APIs) to assess interventions’ impacts

Thank you!


Rosa Félix

✉️ ushift@tecnico.ulisboa.pt
💾 Methodological Report: u-shift.github.io/IMPT-data
🌐 Dashboard and Data: ushift.pt/apps/impt
📄 Paper in preparation


🔗 ushift.pt/apps/impt

This research was funded by Science4Policy, a PLANAPP - Centre for Planning and Evaluation of Public Policies iniciative to support the definition and implementation of public policies based on scientific evidence, under the Science4Policy (S4P): Concurso de Estudos de Ciência para as Políticas Públicas call (PLANAPP-S4P/8042/2025).
This research was funded in part by the FCT - Fundação para a Ciência e Tecnologia under Grant UID/6438/2025 of the research unit CERIS.


References

Allen, Jeff, and Steven Farber. 2019. “Sizing up Transport Poverty: A National Scale Accounting of Low-Income Households Suffering from Inaccessibility in Canada, and What to Do about It.” Transport Policy 74: 214–23. https://doi.org/10.1016/j.tranpol.2018.11.018.
Carlino, Dustin, and Robin Lovelace. 2022. Odjitter: Jitter Origin-Destination Data. https://github.com/itsleeds/odjitter.
European Commission. Directorate General for Employment, Social Affairs, and Inclusion. 2024. Transport Poverty: Definitions, Indicators, Determinants, and Mitigation Strategies: Final Report. Publications Office of the European Union. https://doi.org/10.2767/0662480.
European Parliament and the Council of the European Union. 2023. Regulation (EU) 2023/955.” In Official Journal of the European Union, 2023/955, vol. L130. https://eur-lex.europa.eu/legal-content/EN/TXT/PDF/?uri=CELEX:32023R0955.
Isalou, Ali A., Todd Litman, and Behzad Shahmoradi. 2014. “Testing the Housing and Transportation Affordability Index in a Developing World Context: A Sustainability Comparison of Central and Suburban Districts in Qom, Iran.” Transport Policy 33: 33–39. https://doi.org/10.1016/j.tranpol.2014.02.006.
Litman, Todd. 2026. “Evaluating Transportation Affordability.” In Victoria Transport Policy Institute. https://www.vtpi.org/affordability.pdf.
Lucas, Karen, Ersilia Verlinghieri, and Alvaro Guzman. 2016. “Transport Poverty and Its Adverse Social Consequences.” Proceedings of the Institution of Civil Engineers - Transport 169 (6): 353–65. https://doi.org/10.1680/jtran.15.00073.
Mejia-Dorantes, L., and I. Murauskaite-Bull. 2022. Transport Poverty: A Systematic Literature Review in Europe. Publications Office of the European Union. https://doi.org/10.2760/793538.
OECD, European Union, and Joint Research Centre - European Commission. 2008. Handbook on Constructing Composite Indicators: Methodology and User Guide. OECD Publishing. https://doi.org/10.1787/9789264043466-en.
Pereira, Rafael H. M., and Daniel Herszenhut. 2022. Accessibility: Transport Accessibility Measures. https://ipeagit.github.io/accessibility/.
Pereira, Rafael H. M., Marcus Saraiva, Daniel Herszenhut, Carlos K. V. Braga, and Matthew Wigginton Conway. 2021. “R5r: Rapid Realistic Routing on Multimodal Transport Networks with R5 in R.” Findings, ahead of print. https://doi.org/10.32866/001c.21262.
Pritchard, John P., Filipe Moura, João de Abreu e Silva, and Luiz M. Martinez. 2014. “Spatial Analysis of Transportation-Related Social Exclusion in the Lisbon Metropolitan Area.” Procedia - Social and Behavioral Sciences 111: 440–49. https://doi.org/10.1016/j.sbspro.2014.01.077.